Targeted lipidomics reveals mPGES-1-PGE2 as a therapeutic target for multiple sclerosis
- PMID: 19995978
- PMCID: PMC2789753
- DOI: 10.1073/pnas.0906891106
Targeted lipidomics reveals mPGES-1-PGE2 as a therapeutic target for multiple sclerosis
Abstract
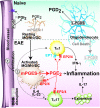
The arachidonic acid (AA) cascade produces eicosanoids, such as prostaglandins (PGs), that regulate physiological and pathological functions. Although various nonsteroidal anti-inflammatory drugs have been developed, blocking upstream components (cyclooxygenase-1 and -2) of the AA cascade leads to severe side effects, including gastrointestinal ulcers and cardiovascular events, respectively, due to the complexity of the AA cascade. Here, using an AA cascade-targeted lipidomics approach, we report that microsomal PGE synthase 1 (mPGES-1) plays a key role in experimental autoimmune encephalomyelitis (EAE). Eicosanoids (mainly PGD(2)) are produced constitutively in the spinal cord of naive mice. However, in EAE lesions, the PGE(2) pathway is favored and the PGD(2), PGI(2), and 5-lipoxygenase pathways are attenuated. Furthermore, mPGES-1(-/-) mice showed less severe symptoms of EAE and lower production of IL-17 and IFN-gamma than mPGES-1(+/+) mice. Expression of PGE(2) receptors (EP1, EP2, and EP4) was elevated in EAE lesions and correlated with clinical symptoms. Immunohistochemistry on central nervous systems of EAE mice and multiple sclerosis (MS) patients revealed overt expression of mPGES-1 protein in microglia/macrophages. Thus, the mPGES-1-PGE(2)-EPs axis of the AA cascade may exacerbate EAE pathology. Our findings have important implications for the design of therapies for MS.
Conflict of interest statement
The authors declare no conflict of interest.
Figures


Similar articles
-
Microsomal prostaglandin E synthase-1 aggravates inflammation and demyelination in a mouse model of multiple sclerosis.Neurochem Int. 2013 Feb;62(3):271-80. doi: 10.1016/j.neuint.2012.12.007. Epub 2012 Dec 22. Neurochem Int. 2013. PMID: 23266396
-
Anti-inflammatory role of microsomal prostaglandin E synthase-1 in a model of neuroinflammation.J Biol Chem. 2011 Jan 21;286(3):2331-42. doi: 10.1074/jbc.M110.157362. Epub 2010 Nov 12. J Biol Chem. 2011. PMID: 21075851 Free PMC article.
-
Prostaglandin E2 is an enhancer of interleukin-1beta-induced expression of membrane-associated prostaglandin E synthase in rheumatoid synovial fibroblasts.Arthritis Rheum. 2003 Oct;48(10):2819-28. doi: 10.1002/art.11261. Arthritis Rheum. 2003. PMID: 14558087
-
Perspective of microsomal prostaglandin E2 synthase-1 as drug target in inflammation-related disorders.Biochem Pharmacol. 2015 Nov 1;98(1):1-15. doi: 10.1016/j.bcp.2015.06.022. Epub 2015 Jun 27. Biochem Pharmacol. 2015. PMID: 26123522 Review.
-
Microsomal prostaglandin E synthase-1 inhibition in cardiovascular inflammatory disease.J Intern Med. 2008 May;263(5):500-5. doi: 10.1111/j.1365-2796.2008.01938.x. J Intern Med. 2008. PMID: 18410593 Review.
Cited by
-
Chronic immobilisation stress ameliorates clinical score and neuroinflammation in a MOG-induced EAE in Dark Agouti rats: mechanisms implicated.J Neuroinflammation. 2010 Oct 7;7:60. doi: 10.1186/1742-2094-7-60. J Neuroinflammation. 2010. PMID: 20929574 Free PMC article.
-
Cyclooxygenase expression and prostaglandin levels in central nervous system tissues during the course of chronic relapsing experimental autoimmune encephalomyelitis (EAE).Inflamm Res. 2011 Oct;60(10):919-28. doi: 10.1007/s00011-011-0352-3. Epub 2011 Jun 12. Inflamm Res. 2011. PMID: 21667309
-
Ketogenic diets attenuate cyclooxygenase and lipoxygenase gene expression in multiple sclerosis.EBioMedicine. 2018 Oct;36:293-303. doi: 10.1016/j.ebiom.2018.08.057. Epub 2018 Oct 3. EBioMedicine. 2018. PMID: 30292675 Free PMC article. Clinical Trial.
-
Atf3 negatively regulates Ptgs2/Cox2 expression during acute inflammation.Prostaglandins Other Lipid Mediat. 2015 Jan-Mar;116-117:49-56. doi: 10.1016/j.prostaglandins.2015.01.001. Epub 2015 Jan 22. Prostaglandins Other Lipid Mediat. 2015. PMID: 25619459 Free PMC article.
-
Modeling of eicosanoid fluxes reveals functional coupling between cyclooxygenases and terminal synthases.Biophys J. 2014 Feb 18;106(4):966-75. doi: 10.1016/j.bpj.2014.01.015. Biophys J. 2014. PMID: 24559999 Free PMC article.
References
-
- McFarland HF, Martin R. Multiple sclerosis: A complicated picture of autoimmunity. Nat Immunol. 2007;8:913–919. - PubMed
-
- Bettelli E, Oukka M, Kuchroo VK. T(H)-17 cells in the circle of immunity and autoimmunity. Nat Immunol. 2007;8:345–350. - PubMed
-
- Kanter JL, et al. Lipid microarrays identify key mediators of autoimmune brain inflammation. Nat Med. 2006;12:138–143. - PubMed
Publication types
MeSH terms
Substances
LinkOut - more resources
Full Text Sources
Other Literature Sources
Medical
Molecular Biology Databases
Miscellaneous

