. 2010 Feb 12;285(7):4837-46.
doi: 10.1074/jbc.M109.070045. Epub 2009 Dec 7.

Phospholipase C-related but catalytically inactive protein is required for insulin-induced cell surface expression of gamma-aminobutyric acid type A receptors

Affiliations

Phospholipase C-related but catalytically inactive protein is required for insulin-induced cell surface expression of gamma-aminobutyric acid type A receptors

Makoto Fujii et al. J Biol Chem. .

Abstract

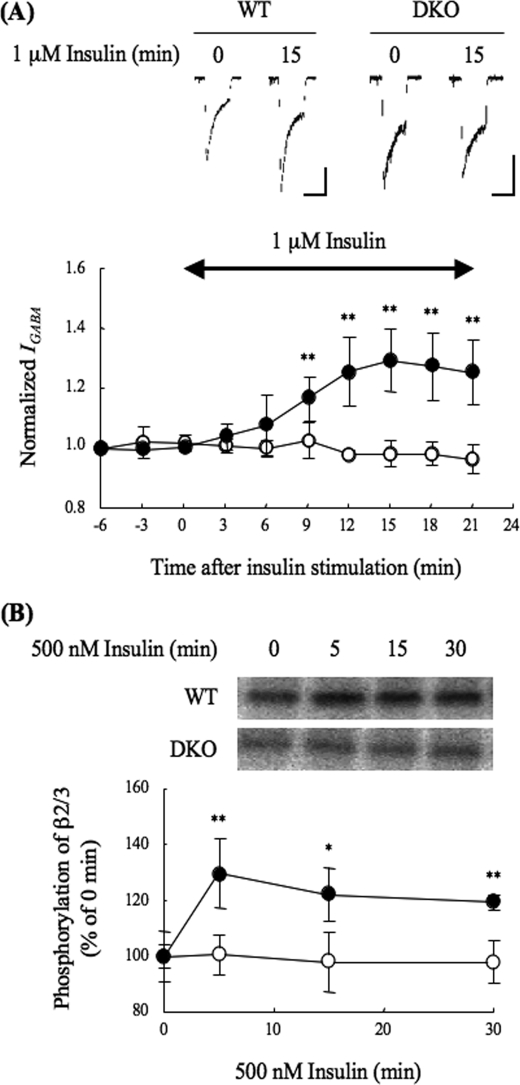
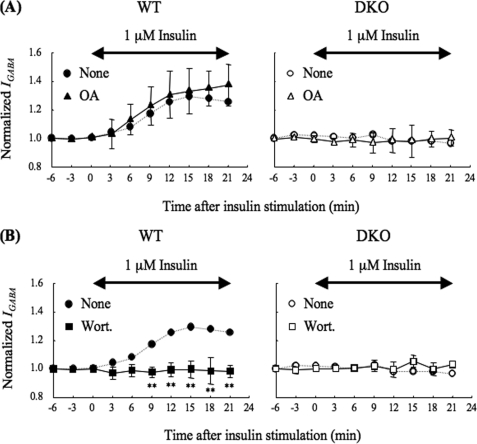
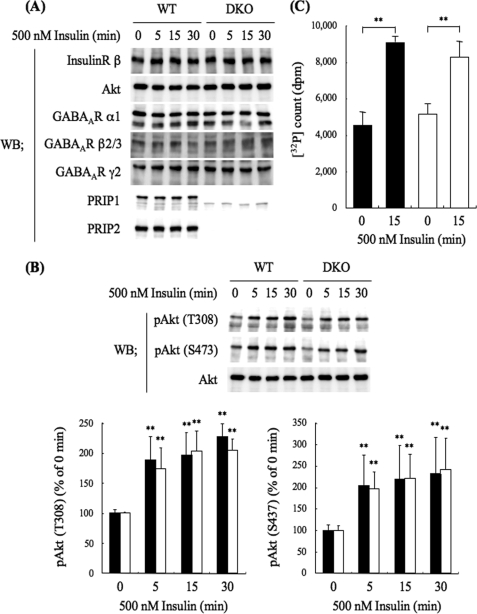
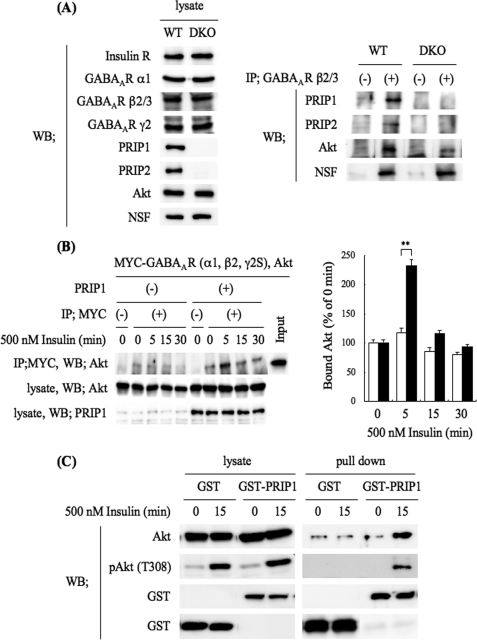
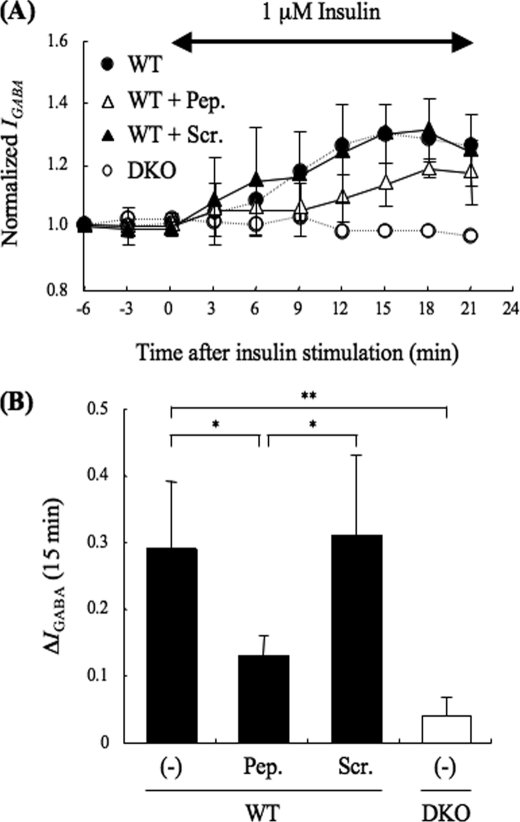
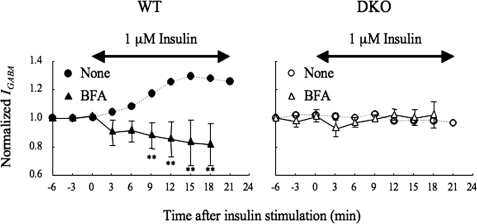
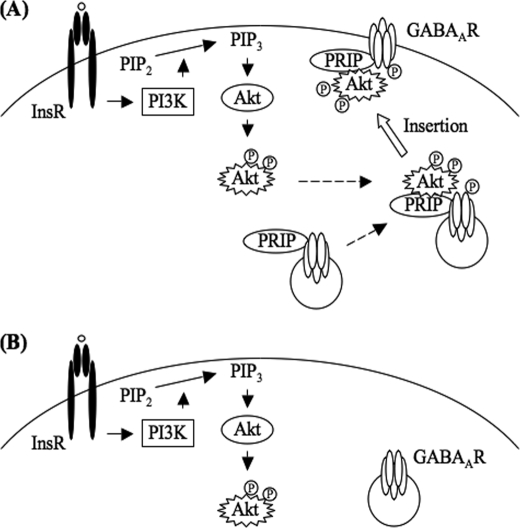
The gamma-aminobutyric acid type A (GABA(A)) receptors play a pivotal role in fast synaptic inhibition in the central nervous system. One of the key factors for determining synaptic strength is the number of receptors on the postsynaptic membrane, which is maintained by the balance between cell surface insertion and endocytosis of the receptors. In this study, we investigated whether phospholipase C-related but catalytically inactive protein (PRIP) is involved in insulin-induced GABA(A) receptor insertion. Insulin potentiated the GABA-induced Cl(-) current (I(GABA)) by about 30% in wild-type neurons, but not in PRIP1 and PRIP2 double-knock-out (DKO) neurons, suggesting that PRIP is involved in insulin-induced potentiation. The phosphorylation level of the GABA(A) receptor beta-subunit was increased by about 30% in the wild-type neurons but not in the mutant neurons, which were similar to the changes observed in I(GABA). We also revealed that PRIP recruited active Akt to the GABA(A) receptors by forming a ternary complex under insulin stimulation. The disruption of the binding between PRIP and the GABA(A) receptor beta-subunit by PRIP interference peptide attenuated the insulin potentiation of I(GABA). Taken together, these results suggest that PRIP is involved in insulin-induced GABA(A) receptor insertion by recruiting active Akt to the receptor complex.


Figures

FIGURE 1.
FIGURE 1.
Electrophysiological analysis of IGABA in insulin-stimulated hippocampal CA1 neurons and phosphorylation of the GABAA receptor β2/3-subunit. A, effect of insulin on IGABA. Electrophysiological experiments were performed using acutely prepared hippocampal CA1 neurons from WT (closed circles, n = 5) or DKO (open circles, n = 5) mice. GABA (3 μm) was applied for 15 s (3-min interval), and whole cell currents were recorded. Insulin (1 μm) was applied for the time period indicated by the double-headed arrow in graph. Upper panel shows representative GABA-induced current traces at 0 min or 15 min after insulin stimulation of WT or DKO neurons. Vertical and horizontal scales show 200 pA and 15 s, respectively. The graph shows the amplitude of IGABA normalized to that seen without insulin. All data are represented as means ± S.D. Significance was determined using the Student's t test (**, p < 0.01, compared with the results from DKO). B, phosphorylation of the β-subunit in response to insulin stimulation. The cultured cortical neurons (DIV. 14–18) of the WT or DKO mice were metabolically labeled with [32P]orthophosphates for 4 h. The neurons were stimulated with 500 nm insulin for the indicated time, and then the cell lysates were subjected to immunoprecipitation using an anti-GABAA receptor β2/3-subunit antibody. The immunocomplexes were separated by SDS-PAGE and then subjected to autoradiography. Phosphorylated bands were detected using BAS2500. The autoradiograph represents one of four independent experiments. The other experiments gave similar results. The graph shows quantitative data concerning the phosphorylation of the GABAA receptor β2/3-subunit of WT (closed circles) or DKO (open circles) neurons. As mentioned above, 32P incorporation was analyzed, because the phosphospecific antibody currently available recognizes the di-phosphorylated β3-subunit at both Ser-408 and Ser-409 (29, 41), and insulin causes a single phosphorylation at Ser-410 or Ser-409 of β2- or β3-subunit, respectively (11, 12). Data are represented as means ± S.D. (n = 4). Significance was determined using the Student's t test (*, p < 0.05; **, p < 0.01, compared with the results from DKO).
FIGURE 2.
FIGURE 2.
Effect of okadaic acid or wortmannin on the insulin-potentiation of IGABA. A, effect of okadaic acid on the insulin potentiation of IGABA. Neurons from WT (left panel, closed triangles, n = 8) or DKO (right panel, open triangles, n = 3) mice were pretreated with 10 μm okadaic acid, an inhibitor of the protein phosphatases PP1 and PP2A (42), for 15 min and throughout the experiment. The experiment was performed as shown in Fig. 1A except for the okadaic acid treatment. All data are represented as means ± S.D. The IGABA from WT (left panel, closed circles, dashed line) or DKO (right panel, open circles, dashed line) mice without okadaic acid (none), which were taken from Fig. 1A, are also shown as references. B, effect of wortmannin on the insulin potentiation of IGABA. Neurons from WT (left panel, closed squares, n = 6) or DKO (right panel, open squares, n = 3) mice were pretreated with 100 nm of wortmannin, a potent PI 3-kinase inhibitor (45), for 15 min and throughout the experiment. The experiments were performed as shown in Fig. 1A except for the wortmannin treatment. All data are represented as means ± S.D. The IGABA from WT (left panel, closed circles, dashed line) or DKO (right panel, open circles, dashed line) mice without wortmannin (none), which were taken from those shown in Fig. 1A, are also shown as references. Double-headed arrows indicate the period of insulin stimulation. Significance was determined using the Student's t test (**, p < 0.01 from the results obtained in the absence of the drug). none, no addition; OA, okadaic acid; Wort, wortmannin.
FIGURE 3.
FIGURE 3.
PRIP deficiency caused little changes in the expression level of molecules possibly involved in insulin signaling. A, Western blotting analysis of the expression level of insulin signaling molecules. WT or DKO cortical neurons were cultured for 14–18 days and then stimulated with 500 nm insulin for the indicated time. The cell lysates were analyzed by Western blotting using the indicated antibodies shown on the left. The blot shown is a typical result from six experiments. B, Western blotting analysis of Akt activation. The WT or DKO cortical cell lysates were prepared in the same way as described above and analyzed by Western blotting using antiphospho-Akt antibodies. The blot and graph shown are a typical result and the summary of seven experiments, respectively. The densities of phospho-Akt at Thr-308 (left panel) and Ser-473 (right panel) relative to the total amount of Akt are shown. The filled and open columns represent the results obtained for WT and DKO mice, respectively. C, Akt kinase activity assayed in vitro. The cell lysates of WT (filled columns) or DKO (open columns) neurons stimulated with 500 nm insulin for 15 min were subjected to immunoprecipitation using an anti-Akt antibody. The immunocomplexes were subjected to an Akt kinase assay using crosstide as a substrate and [γ-32P]ATP. Data are represented as means ± S.D. (n = 3). Significance was determined by Student's t test (*, p < 0.05; **, p < 0.01, compared with the result before insulin stimulation), but no difference was detected between WT and DKO.
FIGURE 4.
FIGURE 4.
Complex formation among GABAA receptor, PRIP, and Akt. A, GABAA receptors were immunoprecipitated using an anti-GABAA receptor β2/3-subunit antibody from WT or DKO brain lysates. The cell lysates (left panel) and immunoprecipitates (right panel) were analyzed by Western blotting using the indicated antibodies shown on the left. The blots shown are from one of three independent experiments. The other experiments gave similar results. B, Myc-tagged GABAA receptor subunits (α1, β2, and γ2S) and Akt with or without PRIP1 were exogenously expressed in HEK293 cells. After stimulation with 500 nm insulin for the indicated time, the cell lysates were subjected to immunoprecipitation using an anti-Myc antibody. The immunocomplexes were separated by SDS-PAGE and then analyzed by Western blotting using an anti-Akt antibody. The cell lysates were also analyzed by Western blotting using the indicated antibodies. The blots shown are one of three independent experiments. The other experiments gave similar results. The graph shows quantitative data concerning the Akt co-precipitated with GABAA receptors in PRIP expressing (filled columns) or control (open columns) cells. Significance was determined using the Student's t test (**, p < 0.01 from the control cells without exogenous PRIP1). C, HEK293 cells were transfected with Akt and GST-PRIP1 (or GST) expression plasmids. After stimulation with 500 nm insulin for 15 min, GST fusion proteins were precipitated with glutathione-SepharoseTM 4B. The protein complexes were separated by SDS-PAGE and then analyzed by Western blotting using an anti-Akt antibody, an antiphospho-Akt (Thr-308), and an anti-GST polyclonal antibody. The cell lysates were also analyzed by Western blotting using the indicated antibodies. The blots shown are one of three independent experiments. The other experiments gave similar results.
FIGURE 5.
FIGURE 5.
Effect of PRIP1-(553–565) peptide on insulin potentiation of IGABA in hippocampal CA1 neurons. A, PRIP1-(553–565) peptide (3 μg/ml) (open triangles, n = 3), which diminishes the binding between PRIP and the GABAA receptor β-subunit (29), or its scramble peptide (3 μg/ml) (closed triangles, n = 3) were introduced using a patch pipette. The experiment was performed in the same way as that shown in Fig. 1A. A double-headed arrow indicates the time period of insulin application. Data are represented by the means ± S.D.. The IGABA from WT (closed circles, dashed line) or DKO (open circles, dashed line) mice without the peptide, which were taken from those shown in Fig. 1A, are also shown as references. B, graph shows the potentiation of IGABA at 15 min after insulin stimulation in WT (filled columns) or DKO (open column) neurons with or without the indicated peptides (Pep., PRIP1-(553–565 peptides); Scr., PRIP1-(553–565) scramble peptides; (−), no peptides). Data are represented as means ± S.D. Significance was determined using the Student's t test (*, p < 0.05; **, p < 0.01, between indicated two columns).
FIGURE 6.
FIGURE 6.
Effect of BFA on insulin potentiation of IGABA. Neurons from either WT (left panel, closed triangles, n = 3) or DKO (right panel, open triangles, n = 3) were pretreated with 5 μg/ml of BFA, which inhibits anterograde trafficking from the ER to the Golgi apparatus (32, 33) for 15 min and throughout the experiment. The experiment was performed in the same way as that described for Fig. 1A. All data are represented as means ± S.D. The IGABA from either WT or DKO without BFA, which were taken from those shown in Fig. 1A, are also shown as references. Significance was determined using the Student's t test (**, p < 0.01, from the results obtained in the absence of the drug). Double-headed arrows indicate the time period of insulin stimulation. none, no drug; BFA, brefeldin A.
FIGURE 7.
FIGURE 7.
Schematic representation of the role of PRIP in insulin-induced membrane insertion of GABAA receptors. A, insulin stimulation induces Akt activation in a PI 3-kinase-dependent manner. Subsequent phosphorylation of the β-subunits of GABAA receptors by Akt is facilitated by PRIP through the ternary complex formation with activated Akt and β-subunit, which triggers an enhancement of the insertion of GABAA receptors into the postsynaptic membrane. B, absence of PRIP fails in making activated Akt accessible to β-subunit. Arrows indicate the signaling pathways to activate downstream target. Dashed arrows indicate the complex formation. White arrow indicates membrane insertion of GABAA receptor. InsR, insulin receptor; GABAAR, GABAA receptor, PI3K, PI 3-kinase; PIP2, phosphatidylinositol 4,5-bisphosphate; PIP3, phosphatidylinositol 3,4,5-trisphosphate, PRIP, PLC-related but catalytically inactive protein. Circled P indicates the phosphorylation.

Similar articles

Cited by

References

    1. Moss S. J., Smart T. G. (2001) Nat. Rev. Neurosci. 2, 240–250 - PubMed
    1. Lüscher B., Keller C. A. (2004) Pharmacol. Ther. 102, 195–221 - PubMed
    1. Vicini S., Ortinski P. (2004) Pharmacol. Ther. 103, 109–120 - PubMed
    1. Michels G., Moss S. J. (2007) Crit. Rev. Biochem. Mol. Biol. 42, 3–14 - PubMed
    1. Jacob T. C., Moss S. J., Jurd R. (2008) Nat. Rev. Neurosci. 9, 331–343 - PMC - PubMed

Publication types

MeSH terms