. 2010 Feb 26;285(9):6198-207.
doi: 10.1074/jbc.M109.056648. Epub 2009 Dec 7.

Hepatic Bax inhibitor-1 inhibits IRE1alpha and protects from obesity-associated insulin resistance and glucose intolerance

Affiliations

Hepatic Bax inhibitor-1 inhibits IRE1alpha and protects from obesity-associated insulin resistance and glucose intolerance

Béatrice Bailly-Maitre et al. J Biol Chem. .

Abstract

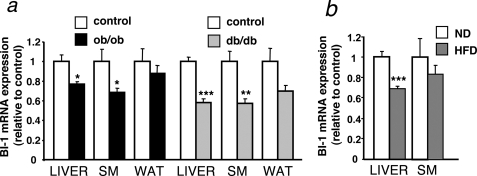
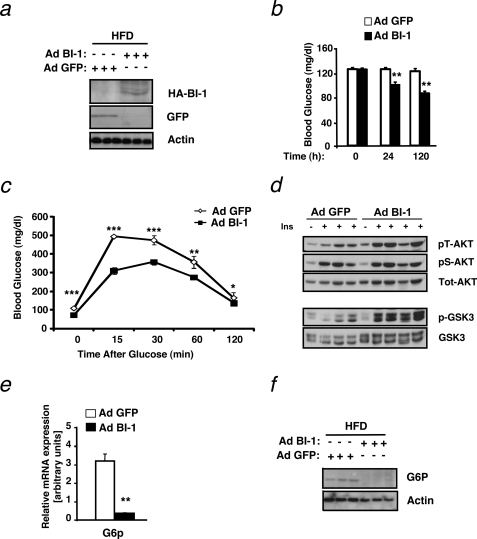
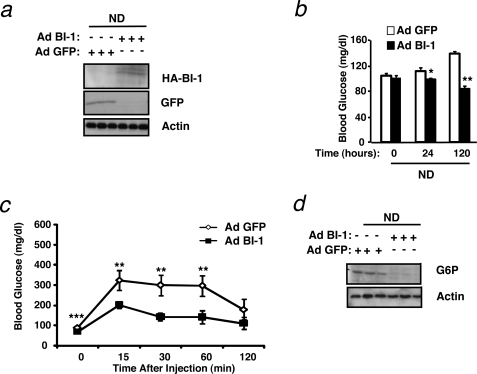
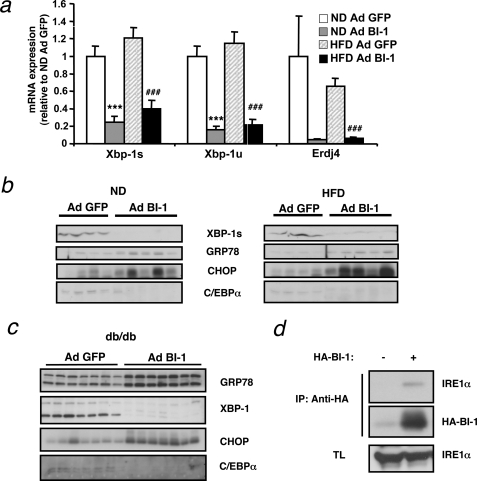
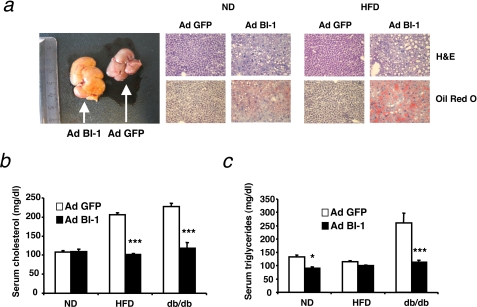
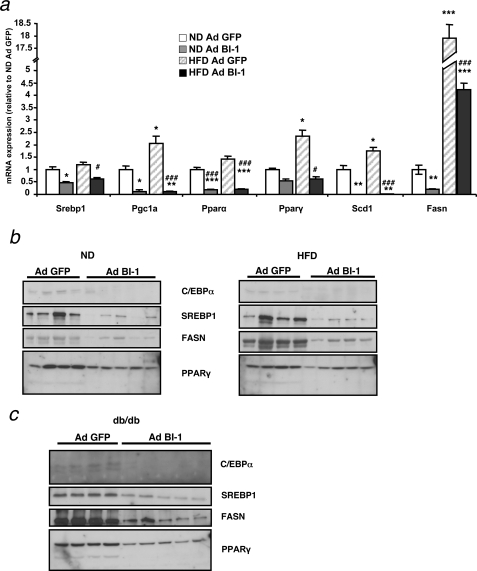
The unfolded protein response (UPR) or endoplasmic reticulum (ER) stress response is a physiological process enabling cells to cope with altered protein synthesis demands. However, under conditions of obesity, prolonged activation of the UPR has been shown to have deteriorating effects on different metabolic pathways. Here we identify Bax inhibitor-1 (BI-1), an evolutionary conserved ER-membrane protein, as a novel modulator of the obesity-associated alteration of the UPR. BI-1 partially inhibits the UPR by interacting with IRE1alpha and inhibiting IRE1alpha endonuclease activity as seen on the splicing of the transcription factor Xbp-1. Because we observed a down-regulation of BI-1 expression in liver and muscle of genetically obese ob/ob and db/db mice as well as in mice with diet-induced obesity in vivo, we investigated the effect of restoring BI-1 expression on metabolic processes in these mice. Importantly, BI-1 overexpression by adenoviral gene transfer dramatically improved glucose metabolism in both standard diet-fed mice as well as in mice with diet-induced obesity and, critically, reversed hyperglycemia in db/db mice. This improvement in whole body glucose metabolism and insulin sensitivity was due to dramatically reduced gluconeogenesis as shown by reduction of glucose-6-phosphatase and phosphoenolpyruvate carboxykinase expression. Taken together, these results identify BI-1 as a critical regulator of ER stress responses in the development of obesity-associated insulin resistance and provide proof of concept evidence that gene transfer-mediated elevations in hepatic BI-1 may represent a promising approach for the treatment of type 2 diabetes.


Figures

FIGURE 1.
FIGURE 1.
Bi-1 expression is decreased in mouse models of obesity and diabetes. a, shown is relative expression of Bi-1 mRNA in the liver, skeletal muscle (SM), and white adipose tissue (WAT) from diabetic (db/db) (filled gray bars), obese (ob/ob) (filled black bars), and age-and sex-matched lean control mice (open bars) (mean ± S.E. of 15 animals in each group). Statistical significance was determined by t test and is denoted by asterisks (* p ≤ 0.05; ** p ≤ 0.01; *** p ≤ 0.001). b, shown is relative expression of Bi-1 mRNA in the liver and skeletal muscle from mice HFD (n = 12) (gray bars)- and ND (n = 8) (white bars)-fed C57Bl/6 mice (mean ± S.E. is shown of each group). Statistical significance was determined by t test and is denoted by asterisks (***, p ≤ 0.001).
FIGURE 2.
FIGURE 2.
Hepatic BI-1 overexpression ameliorates HFD-induced insulin resistance and glucose metabolism. a, immunoblot analysis was performed for BI-1 or GFP and actin in liver lysates from mice provided HFD and infected with Ad BI-1 or Ad GFP. Livers were collected from mice after an overnight fast, and proteins were extracted and processed as described under “Experimental Procedures.” Each lane represents liver lysates from a different mouse. b, shown are blood glucose concentrations (mg/dl) in HFD-fed mice immediately before and 24 and 120 h after adenovirus treatment. The results are the mean ± S.E. of n = 9 mice per group (**, p ≤ 0.01). c, glucose tolerance tests (0.5 g/kg, intraperitoneal) were performed on HFD-fed mice 60 h after adenovirus injection. Results are given as the mean ± S.E., n = 9 per group (*, p ≤ 0.05; **, p ≤ 0.01; ***, p ≤ 0.001). d, shown is insulin-stimulated phosphorylation of AKT (Ser-473 and Thr-308) and GSK3 was measured in liver tissues of Ad BI-1- and Ad GFP-treated HFD-fed mice upon intravenous insulin (Ins, 13 milliunits) injection. e, shown is relative expression of G6p mRNA in the liver of Ad BI-1- or Ad GFP-infected HFD-fed mice (n = 5 per group; **, p ≤ 0.01). f, G6P and actin protein levels in the liver of Ad BI-1- or Ad GFP-infected HFD-fed mice are assessed by immunoblotting (n = 3 of each group).
FIGURE 3.
FIGURE 3.
Hepatic BI-1 expression improves insulin sensitivity and glucose metabolism in db/db mice. a, shown are blood glucose concentrations (mg/dl) in db/db mice immediately before and 24 and 120 h after Ad BI-1 or Ad GFP adenovirus treatment. The results are the mean ± S.E. of n = 10 mice per group (**, p ≤ 0.01). b, shown are overnight fasted blood glucose concentrations (mg/dl) in db/db mice 144 h after adenovirus treatment. The results are the mean ± S.E. of n = 10 mice per group (***, p ≤ 0.001). c, insulin tolerance tests were performed db/db mice 120 h after adenovirus injection. Results are given as the mean ± S.E.; n = 10 per group (*, p ≤ 0.05; **, p ≤ 0.01). d, shown is relative expression of G6p and Pepck mRNA in the liver of Ad BI-1 or Ad GFP infected db/db mice (n = 5 per group; *** p ≤ 0.001). e, pyruvate tolerance tests were performed on db/db mice 120 h after adenovirus injection. Results are given as the mean ± S.E., n = 7–8 per group (*, p ≤ 0.05; ***, p ≤ 0.001). f, daily food intake was measured 24, 48, and 72 h after adenovirus injection. Results are given as the mean ± S.E. (n = 7–8 per group). g, body weight was measured 72 h after adenovirus injection. Results are given as the mean ± S.E., n = 7–8 per group. h, relative fat mass was determined by NMR analysis 128 h after adenovirus injection. Results are given as the mean ± S.E., n = 7–8 per group.
FIGURE 4.
FIGURE 4.
Hepatic BI-1 overexpression increases glucose tolerance in mice fed a normal chow diet. a, immunoblot analysis was performed for BI-1 or GFP and actin on liver lysates from mice provided a normal chow diet and infected with Ad BI-1 or Ad GFP. Livers were collected from mice after an overnight fast, and proteins were extracted and processed as described under “Experimental Procedures.” Each lane represents liver lysates from a different mouse. b, blood glucose concentrations (mg/dl) in ND-fed mice immediately before and 24 and 120 h after adenovirus treatment are shown. The results are the mean ± S.E. of n = 9 mice per group (*, p ≤ 0.05; **, p ≤ 0.01). c, glucose tolerance tests (0.5 g/kg, intraperitoneal) were performed on ND-fed mice 60 h after adenovirus injection. Results are given as the mean ± S.E., n = 9 per group (**, p ≤ 0.01; ***, p ≤ 0.001). d, shown are G6P and actin protein levels in the liver of Ad BI-1- or Ad GFP-infected ND-fed mice as assessed by immunoblotting (n = 3 of each group).
FIGURE 5.
FIGURE 5.
Adenovirus-mediated expression of BI-1 in the liver inhibits IRE-1α-mediated XBP-1 processing. a, shown is relative expression of spliced Xbp-1 (Xbp-1s), unspliced Xbp-1u, and the XBP-1 target Erdj4 in the liver of Ad BI-1-or Ad GFP-infected ND and HFD mice as measured by real-time PCR (n = 5 per group). b, shown are XBP-1s, GRP78, CHOP, and C/EBPα protein levels in the liver of Ad BI-1- or Ad GFP-infected ND- and HFD-fed mice as assessed by immunoblotting (n = 4–5 of each group). c, shown are XBP-1, GRP78, CHOP, and C/EBPα protein levels in the liver of Ad BI-1- or Ad GFP-infected db/db mice as assessed by immunoblotting (n = 7 of each group). d, shown is co-immunoprecipitation (IP) of BI-1 and IRE1α. HeLa cells with tetracycline (TL)-inducible HA-tagged BI-1 expression were either stimulated with (+) or without (−) doxycycline. BI-1 was immunoprecipitated using α-HA antibody, and its interaction with IRE1α was assessed by immunoblotting.
FIGURE 6.
FIGURE 6.
Adenovirus-mediated expression of BI-1 in the liver induces steatosis and decreases circulating cholesterol and triglycerides. a, representative livers of Ad BI-1- or Ad GFP-infected HFD-fed mice are shown on the left. Hematoxylin and eosin (H&E) and Oil Red O stainings of liver sections of Ad BI-1- or Ad GFP-infected ND- and HFD-fed mice are shown on the right. b, shown are fasting serum cholesterol concentrations from Ad BI-1- or Ad GFP-infected ND, HFD, and db/db mice (n = 9 per group; ***, p ≤ 0.001). c, shown is fasting serum triglyceride concentrations from Ad BI-1- or Ad GFP-infected ND, HFD, and db/db mice (n = 9 per group; *, p ≤ 0.05; ***, p ≤ 0.001).
FIGURE 7.
FIGURE 7.
Effect of adenovirus-mediated expression of BI-1 on hepatic liver metabolism. a, shown is relative mRNA expression of sterol response element-binding protein 1 (Srebp1), PPARγ coactivator 1α (Pgc1α), peroxisome proliferator-activated receptor α and γ (Pparα, Pparγ), stearoyl-coenzyme A desaturase 1 (Scd1), and fatty acid synthase (Fasn) in the liver of Ad BI-1- or Ad GFP-infected ND and HFD mice as measured by real-time PCR (n = 5 per group). b, shown are C/EBPα, SREBP1, FASN, and PPARγ protein levels in the liver of Ad BI-1- or Ad GFP-infected ND- and HFD-fed mice as assessed by immunoblotting (n = 4–5 of each group). c, shown are C/EBPα, SREBP1, FASN, and PPARγ protein levels in the liver of Ad BI-1- or Ad GFP-infected db/db mice as assessed by immunoblotting (n = 4–5 of each group).

References

    1. Haslam D. W., James W. P. (2005) Lancet 366, 1197–1209 - PubMed
    1. Permutt M. A., Wasson J., Cox N. (2005) J. Clin. Invest. 115, 1431–1439 - PMC - PubMed
    1. Ozcan U., Cao Q., Yilmaz E., Lee A. H., Iwakoshi N. N., Ozdelen E., Tuncman G., Görgün C., Glimcher L. H., Hotamisligil G. S. (2004) Science 306, 457–461 - PubMed
    1. Ozcan U., Yilmaz E., Ozcan L., Furuhashi M., Vaillancourt E., Smith R. O., Görgün C. Z., Hotamisligil G. S. (2006) Science 313, 1137–1140 - PMC - PubMed
    1. Oyadomari S., Harding H. P., Zhang Y., Oyadomari M., Ron D. (2008) Cell Metab. 7, 520–532 - PMC - PubMed

Publication types

MeSH terms