

Cerebrospinal fluid steroidomics: are bioactive bile acids present in brain?
- PMID: 19996111
- PMCID: PMC2836072
- DOI: 10.1074/jbc.M109.086678
Cerebrospinal fluid steroidomics: are bioactive bile acids present in brain?
Abstract
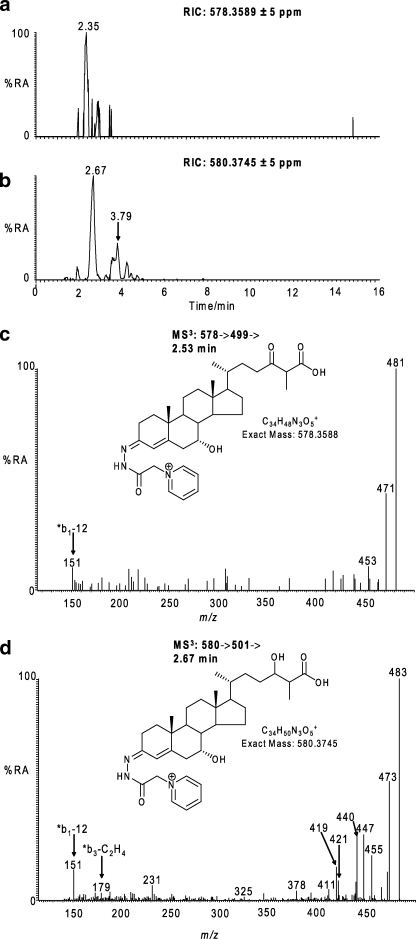
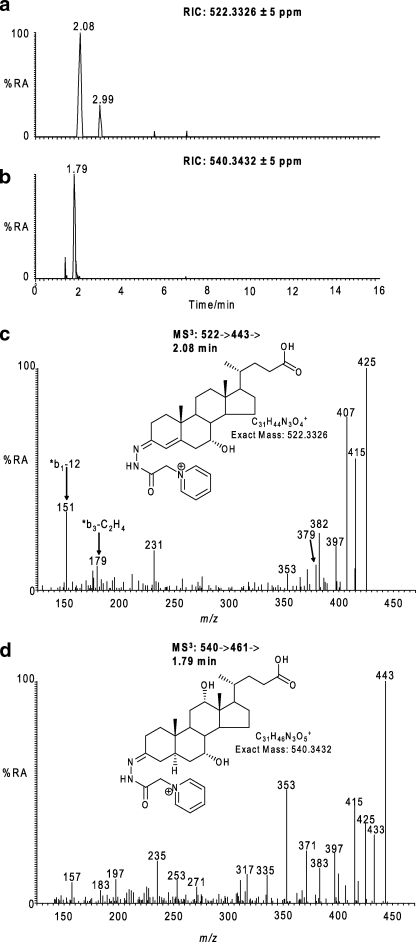
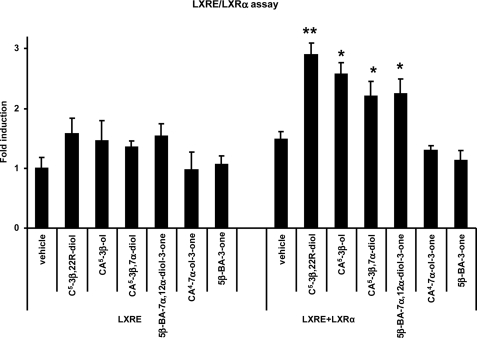
In this study we have profiled the free sterol content of cerebrospinal fluid by a combination of charge tagging and liquid chromatography-tandem mass spectrometry. Surprisingly, the most abundant cholesterol metabolites were found to be C(27) and C(24) intermediates of the bile acid biosynthetic pathways with structures corresponding to 7alpha-hydroxy-3-oxocholest-4-en-26-oic acid (7.170 +/- 2.826 ng/ml, mean +/- S.D., six subjects), 3beta-hydroxycholest-5-en-26-oic acid (0.416 +/- 0.193 ng/ml), 7alpha,x-dihydroxy-3-oxocholest-4-en-26-oic acid (1.330 +/- 0.543 ng/ml), and 7alpha-hydroxy-3-oxochol-4-en-24-oic acid (0.172 +/- 0.085 ng/ml), and the C(26) sterol 7alpha-hydroxy-26-norcholest-4-ene-3,x-dione (0.204 +/- 0.083 ng/ml), where x is an oxygen atom either on the CD rings or more likely on the C-17 side chain. The ability of intermediates of the bile acid biosynthetic pathways to activate the liver X receptors (LXRs) and the farnesoid X receptor was also evaluated. The acidic cholesterol metabolites 3beta-hydroxycholest-5-en-26-oic acid and 3beta,7alpha-dihydroxycholest-5-en-26-oic acid were found to activate LXR in a luciferase assay, but the major metabolite identified in this study, i.e. 7alpha-hydroxy-3-oxocholest-4-en-26-oic acid, was not an LXR ligand. 7Alpha-hydroxy-3-oxocholest-4-en-26-oic acid is formed from 3beta,7alpha-dihydroxycholest-5-en-26-oic acid in a reaction catalyzed by 3beta-hydroxy-Delta(5)-C(27)-steroid dehydrogenase (HSD3B7), which may thus represent a deactivation pathway of LXR ligands in brain. Significantly, LXR activation has been found to reduce the symptoms of Alzheimer disease (Fan, J., Donkin, J., and Wellington C. (2009) Biofactors 35, 239-248); thus, cholesterol metabolites may play an important role in the etiology of Alzheimer disease.
Figures


Similar articles
-
Identification of 7α,24-dihydroxy-3-oxocholest-4-en-26-oic and 7α,25-dihydroxy-3-oxocholest-4-en-26-oic acids in human cerebrospinal fluid and plasma.Biochimie. 2018 Oct;153:86-98. doi: 10.1016/j.biochi.2018.06.020. Epub 2018 Jun 28. Biochimie. 2018. PMID: 29960034 Free PMC article.
-
Cholestenoic acids regulate motor neuron survival via liver X receptors.J Clin Invest. 2014 Nov;124(11):4829-42. doi: 10.1172/JCI68506. Epub 2014 Oct 1. J Clin Invest. 2014. PMID: 25271621 Free PMC article.
-
Defective cholesterol metabolism in amyotrophic lateral sclerosis.J Lipid Res. 2017 Jan;58(1):267-278. doi: 10.1194/jlr.P071639. Epub 2016 Nov 3. J Lipid Res. 2017. PMID: 27811233 Free PMC article.
-
Transcriptional integration of metabolism by the nuclear sterol-activated receptors LXR and FXR.Nat Rev Mol Cell Biol. 2012 Mar 14;13(4):213-24. doi: 10.1038/nrm3312. Nat Rev Mol Cell Biol. 2012. PMID: 22414897 Free PMC article. Review.
-
Oxysterols, cholesterol homeostasis, and Alzheimer disease.J Neurochem. 2007 Sep;102(6):1727-1737. doi: 10.1111/j.1471-4159.2007.04689.x. Epub 2007 Jun 15. J Neurochem. 2007. PMID: 17573819 Review.
Cited by
-
Quantification of Bile Acids in Cerebrospinal Fluid: Results of an Observational Trial.Biomedicines. 2023 Nov 1;11(11):2947. doi: 10.3390/biomedicines11112947. Biomedicines. 2023. PMID: 38001948 Free PMC article.
-
Chronic exposure to ambient traffic-related air pollution (TRAP) alters gut microbial abundance and bile acid metabolism in a transgenic rat model of Alzheimer's disease.Toxicol Rep. 2022 Mar 10;9:432-444. doi: 10.1016/j.toxrep.2022.03.003. eCollection 2022. Toxicol Rep. 2022. PMID: 35310146 Free PMC article.
-
Formation and metabolism of oxysterols and cholestenoic acids found in the mouse circulation: Lessons learnt from deuterium-enrichment experiments and the CYP46A1 transgenic mouse.J Steroid Biochem Mol Biol. 2019 Dec;195:105475. doi: 10.1016/j.jsbmb.2019.105475. Epub 2019 Sep 18. J Steroid Biochem Mol Biol. 2019. PMID: 31541728 Free PMC article.
-
Bile acid composition regulates GPR119-dependent intestinal lipid sensing and food intake regulation in mice.Gut. 2020 Sep;69(9):1620-1628. doi: 10.1136/gutjnl-2019-319693. Epub 2020 Feb 28. Gut. 2020. PMID: 32111630 Free PMC article.
-
Emerging Roles of Bile Acids and TGR5 in the Central Nervous System: Molecular Functions and Therapeutic Implications.Int J Mol Sci. 2024 Aug 27;25(17):9279. doi: 10.3390/ijms25179279. Int J Mol Sci. 2024. PMID: 39273226 Free PMC article. Review.
References
-
- Björkhem I., Cedazo-Minguez A., Leoni V., Meaney S. (2009) Mol. Aspects Med. 30, 171–179 - PubMed
-
- Griffiths W. J., Wang Y. (2009) J. Chromatogr. B Analyt. Technol. Biomed. Life Sci. 877, 2778–2805 - PubMed
-
- Leoni V. (2009) Scand. J. Clin. Lab. Invest. 69, 22–25 - PubMed
-
- Lütjohann D. (2006) Acta Neurol. Scand. Suppl.185, 33–42 - PubMed
-
- Dietschy J. M., Turley S. D. (2004) J. Lipid Res. 45, 1375–1397 - PubMed
Publication types
MeSH terms
Substances
Grants and funding
- BB/C511356/1/BB_/Biotechnology and Biological Sciences Research Council/United Kingdom
- BB/C515771/2/BB_/Biotechnology and Biological Sciences Research Council/United Kingdom
- BBC5157712/BB_/Biotechnology and Biological Sciences Research Council/United Kingdom
- BBC5113561/BB_/Biotechnology and Biological Sciences Research Council/United Kingdom
LinkOut - more resources
Full Text Sources
Other Literature Sources
Research Materials
