Review
. 2010 Jan;36(1):14-23.
doi: 10.1093/schbul/sbp137. Epub 2009 Dec 8.

Narrowing the boundaries of the genetic architecture of schizophrenia

Affiliations
Review

Narrowing the boundaries of the genetic architecture of schizophrenia

Naomi R Wray et al. Schizophr Bull. 2010 Jan.

Abstract

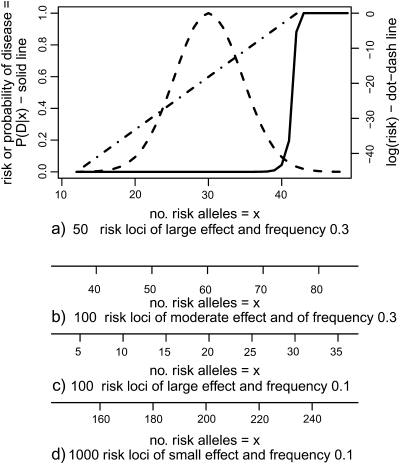
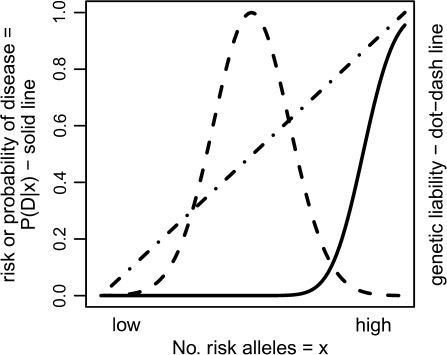
Genetic architecture of a disease comprises the number, frequency, and effect sizes of genetic risk alleles and the way in which they combine together. Before the genomic revolution, the only clue to underlying genetic architecture of schizophrenia came from the recurrence risks to relatives and the segregation patterns within families. From these clues, very simple genetic architectures could be rejected, but many architectures were consistent with the observed family data. The new era of genome-wide association studies can provide further clues to the genetic architecture of schizophrenia. We explore models of genetic architecture by description rather than the mathematics that underpins them. We conclude that the new genome-wide data allow us to narrow the boundaries on the models of genetic architecture that are consistent with the observed data. A genetic architecture of many common variants of moderate (relative risk > approximately 1.2) can be excluded, yet there is evidence that current generation genome-wide chips do tag an important proportion of the genetic variation for schizophrenia and that the underlying causal variants will include common variants of small effect as well as rarer variants of larger effect. Together, these observations imply that the total number of genetic variants is very large--of the order of thousands. The first generation of studies have generated hypotheses that should be testable in the near future and will further narrow the boundaries on genetic architectures that are consistent with empirical data.


Figures

Fig. 1.
Fig. 1.
Visualizing a Genetic Architecture Where Risk Alleles Act Multiplicatively. All examples represent a disease with frequency 0.72% and heritability of ∼0.7. Under a simple multiplicative model of n risk loci contributing to disease each with relative risk R, the probability of disease in an individual carrying x risk loci out of the possible 2n is P(D|x) = BRx,, assuming multiplicativity of risk alleles both within and between loci. B is the probability of disease in individuals carrying no risk loci, ie, P(D|x = 0) = BR0 = B, with B defined so that ΣP(D|x)P(x) = disease prevalence. Because B is very close to 0, x must be high before Rx is big enough to raise BRx from being close to 0. P(D|x) is constrained to have a maximum of 1. Risch did not recognize the need to impose this constraint that impacts on his predicted results (discussed elsewhere5). The dashed bell-shaped line represents the frequency distribution of risk alleles P(x), the straight dot-dashed line represents the additive genetic action on the log(risk) scale, log(P(D|x)) = log(BRx) = xlog(BR), and the solid line represents the multiplicative action of risk alleles on the risk scale, P(D|x) . The same shapes of distributions are seen for different genetic architectures as shown by alternative x-axes a)-d).
Fig. 2.
Fig. 2.
Visualizing the Genetic Architecture of Complex Genetic Disease Under a Liability Threshold Model for a Disease With Frequency 0.72% and Heritability of 0.7. The model is expressed in terms of the genetic variance and so can represent an infinite combination of number of loci, risk allele frequencies, and effect sizes. The black dashed bell-shaped line represents the frequency distribution of liabilities. The straight dot-dashed line represents the additive genetic action on the liability scale. The solid line shows that on the risk scale the risk alleles combine nonadditively.

Similar articles

Cited by

References

    1. Sullivan PF. The genetics of schizophrenia. Plos Med. 2005;2:614–618. - PMC - PubMed
    1. McGue M, Gottesman II, Rao DC. The transmission of schizophrenia under a multifactorial threshold model. Am J Hum Genet. 1983;35:1161–1178. - PMC - PubMed
    1. McGue M, Gottesman II, Rao DC. Resolving genetic models for the transmission of schizophrenia. Genet Epidemiol. 1985;2:99–110. - PubMed
    1. Risch N. Linkage strategies for genetically complex traits. I. Multilocus models. Am J Hum Genet. 1990;46:222–228. - PMC - PubMed
    1. Slatkin M. Exchangeable models of complex inherited diseases. Genetics. 2008;179:2253–2261. - PMC - PubMed

Publication types