

Subregional neuroanatomical change as a biomarker for Alzheimer's disease
- PMID: 19996185
- PMCID: PMC2791580
- DOI: 10.1073/pnas.0906053106
Subregional neuroanatomical change as a biomarker for Alzheimer's disease
Erratum in
- Proc Natl Acad Sci U S A. 2010 Apr 6;107(14):6551. Fenema-Notestine, Christine [corrected to Fennema-Notestine, Christine]
Abstract
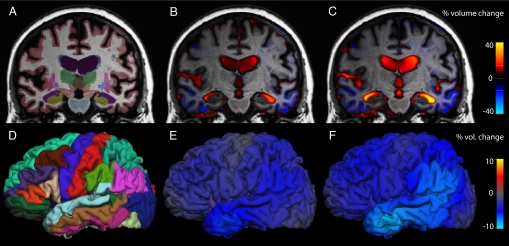
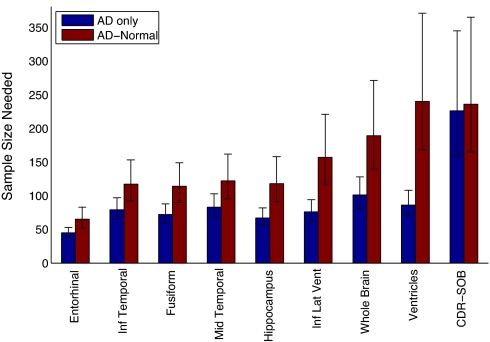
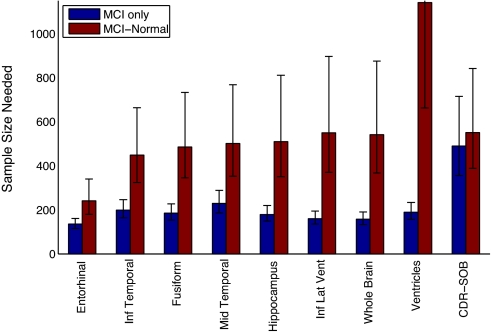
Regions of the temporal and parietal lobes are particularly damaged in Alzheimer's disease (AD), and this leads to a predictable pattern of brain atrophy. In vivo quantification of subregional atrophy, such as changes in cortical thickness or structure volume, could lead to improved diagnosis and better assessment of the neuroprotective effects of a therapy. Toward this end, we have developed a fast and robust method for accurately quantifying cerebral structural changes in several cortical and subcortical regions using serial MRI scans. In 169 healthy controls, 299 subjects with mild cognitive impairment (MCI), and 129 subjects with AD, we measured rates of subregional cerebral volume change for each cohort and performed power calculations to identify regions that would provide the most sensitive outcome measures in clinical trials of disease-modifying agents. Consistent with regional specificity of AD, temporal-lobe cortical regions showed the greatest disease-related changes and significantly outperformed any of the clinical or cognitive measures examined for both AD and MCI. Global measures of change in brain structure, including whole-brain and ventricular volumes, were also elevated in AD and MCI, but were less salient when compared to changes in normal subjects. Therefore, these biomarkers are less powerful for quantifying disease-modifying effects of compounds that target AD pathology. The findings indicate that regional temporal lobe cortical changes would have great utility as outcome measures in clinical trials and may also have utility in clinical practice for aiding early diagnosis of neurodegenerative disease.
Conflict of interest statement
Conflict of interest statement: A.M.D. is a founder and holds equity in CorTechs Labs, Inc, and also serves on the Scientific Advisory Board. The terms of this arrangement have been reviewed and approved by the University of California at San Diego in accordance with its conflict of interest policies.
Figures
References
-
- Braak H, Braak E. Evolution of the neuropathology of Alzheimer's disease. Acta Neurol Scand Suppl. 1996;165:3–12. - PubMed
-
- Atiya M, Hyman BT, Albert MS, Killiany R. Structural magnetic resonance imaging in established and prodromal Alzheimer disease: A review. Alzheimer Dis Assoc Disord. 2003;17:177–195. - PubMed
-
- de Leon MJ, et al. Imaging and CSF studies in the preclinical diagnosis of Alzheimer's disease. Ann N Y Acad Sci. 2007;1097:114–145. - PubMed
Publication types
MeSH terms
Substances
Grants and funding
- K01 AG030514/AG/NIA NIH HHS/United States
- R01 AG031224/AG/NIA NIH HHS/United States
- P50 NS022343/NS/NINDS NIH HHS/United States
- R01 AG027342/AG/NIA NIH HHS/United States
- R01AG031224/AG/NIA NIH HHS/United States
- N01 NS022343/NS/NINDS NIH HHS/United States
- P50MH081755/MH/NIMH NIH HHS/United States
- G0601846/MRC_/Medical Research Council/United Kingdom
- P50 MH081755/MH/NIMH NIH HHS/United States
- P50NS22343/NS/NINDS NIH HHS/United States
- R01 AG022381/AG/NIA NIH HHS/United States
- U01 AG024904/AG/NIA NIH HHS/United States
- U19 AG010483/AG/NIA NIH HHS/United States
- U54 NS056883/NS/NINDS NIH HHS/United States
- U54NS056883/NS/NINDS NIH HHS/United States
- P30 AG019610/AG/NIA NIH HHS/United States
- R01AG22381/AG/NIA NIH HHS/United States
LinkOut - more resources
Full Text Sources
Other Literature Sources
Medical
