. 2010 Feb 5;285(6):4213-4223.
doi: 10.1074/jbc.M109.060301. Epub 2009 Dec 8.

Cell-cell contact formation governs Ca2+ signaling by TRPC4 in the vascular endothelium: evidence for a regulatory TRPC4-beta-catenin interaction

Affiliations

Cell-cell contact formation governs Ca2+ signaling by TRPC4 in the vascular endothelium: evidence for a regulatory TRPC4-beta-catenin interaction

Annarita Graziani et al. J Biol Chem. .

Abstract

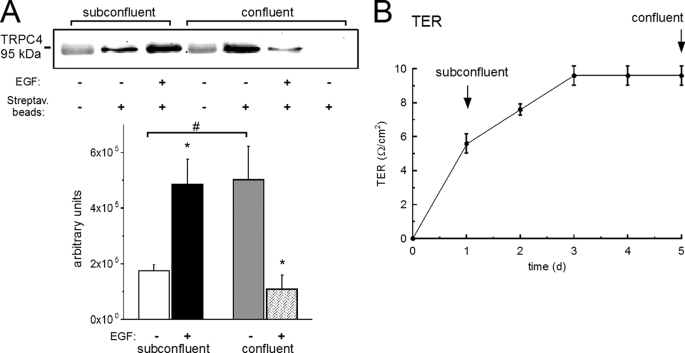
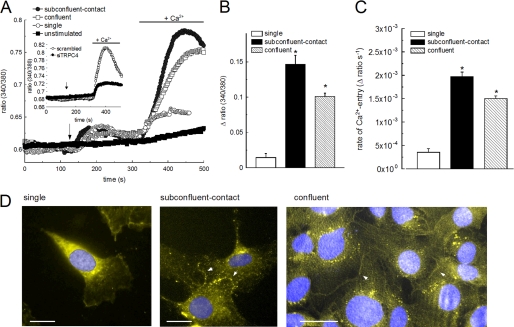
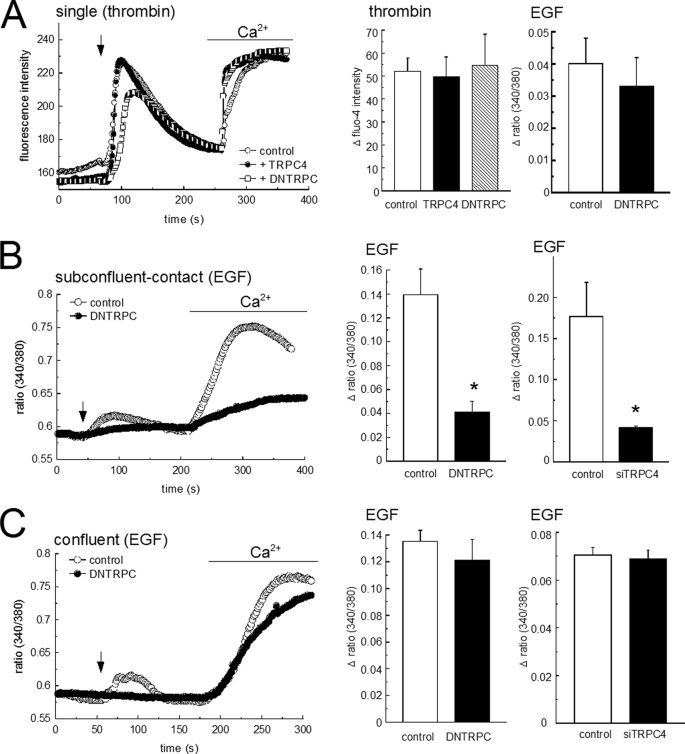
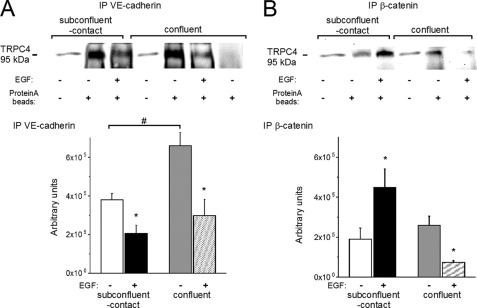
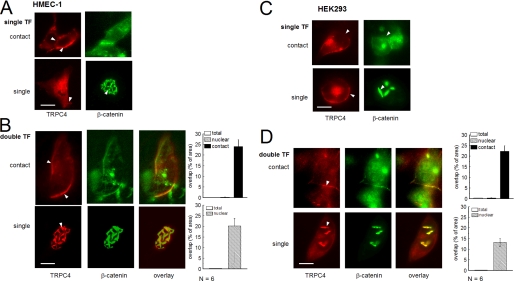
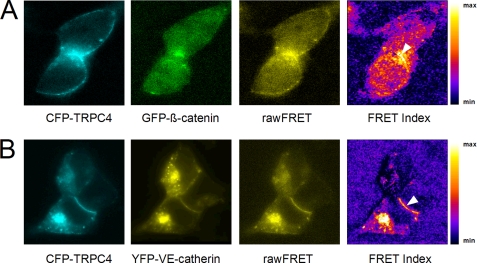
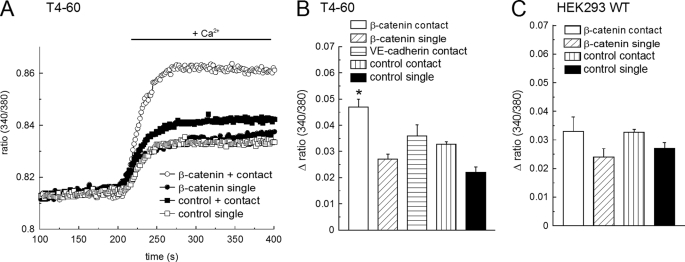
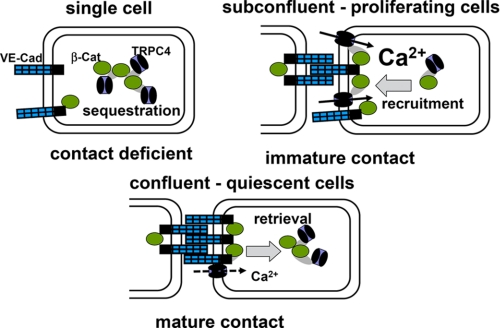
TRPC4 is well recognized as a prominent cation channel in the vascular endothelium, but its contribution to agonist-induced endothelial Ca(2+) entry is still a matter of controversy. Here we report that the cellular targeting and Ca(2+) signaling function of TRPC4 is determined by the state of cell-cell adhesions during endothelial phenotype transitions. TRPC4 surface expression in human microvascular endothelial cells (HMEC-1) increased with the formation of cell-cell contacts. Epidermal growth factor recruited TRPC4 into the plasma membrane of proliferating cells but initiated retrieval of TRPC4 from the plasma membrane in quiescent, barrier-forming cells. Epidermal growth factor-induced Ca(2+) entry was strongly promoted by the formation of cell-cell contacts, and both siRNA and dominant negative knockdown experiments revealed that TRPC4 mediates stimulated Ca(2+) entry exclusively in proliferating clusters that form immature cell-cell contacts. TRPC4 co-precipitated with the junctional proteins beta-catenin and VE-cadherin. Analysis of cellular localization of fluorescent fusion proteins provided further evidence for recruitment of TRPC4 into junctional complexes. Analysis of TRPC4 function in the HEK293 expression system identified beta-catenin as a signaling molecule that enables cell-cell contact-dependent promotion of TRPC4 function. Our results place TRPC4 as a Ca(2+) entry channel that is regulated by cell-cell contact formation and interaction with beta-catenin. TRPC4 is suggested to serve stimulated Ca(2+) entry in a specific endothelial state during the transition from a proliferating to a quiescent phenotype. Thus, TRPC4 may adopt divergent, as yet unappreciated functions in endothelial Ca(2+) homeostasis and emerges as a potential key player in endothelial phenotype switching and tuning of cellular growth factor signaling.


Figures

FIGURE 1.
FIGURE 1.
Membrane presentation of TRPC4 is enhanced by formation of cell-cell contacts and divergently affected by EGF in subconfluent and confluent HMEC-1. A, top, proteins from total cell lysates (lanes 1 and 4), biotinylated fractions (lanes 2, 3, 5, and 6), and non-biotinylated fractions (lane 7) at the indicated conditions were subjected to SDS-PAGE and immunoblotted with TRPC4 antibody. Results are representative of four individual experiments. Bottom, mean values ± S.E. of TRPC4 immunoreactivity detected in biotinylated fractions before and after stimulation with EGF (100 ng/ml, 20 min). *, statistically significant differences between stimulated and unstimulated conditions (p < 0.05); #, statistically significant difference between the unstimulated subconfluent state and the unstimulated confluent state (p < 0.05). B, time course of TER increase in cultured HMEC-1 cells representing the transition from proliferating, subconfluent to barrier forming, confluent populations. TER levels (arrows) were taken as a basis to distinguish proliferating, subconfluent cells from mature barriers characterized by a constant, maximal TER level. The trace represents mean TER ± S.E. (n = 6). d, days.
FIGURE 2.
FIGURE 2.
EGF-induced Ca2+ entry is altered by endothelial phenotype transitions. A, representative records of fura-2 fluorescence ratio in single (migrating state; open circles), subconfluent contact-forming (proliferating clusters; closed circles), and confluent (quiescent, barrier-forming; squares) cells during a Ca2+ readdition after stimulation with EGF (100 ng/ml; arrow). Ca2+ readdition (elevation of extracellular Ca2+ from nominally free to 2 mm) is indicated. Basal Ca2+ entry into non-stimulated cells is shown for proliferating clusters (unstimulated). The inset shows inhibition of Ca2+ entry into EGF-stimulated subconfluent cells by TRPC4 siRNA silencing. Responses of a TRPC4-silenced cell (filled circles) and a control (scrambled; open circles) are shown. B, mean peak increases in fura-2 emission ratios (Δ values ± S.E., n ≥ 45) obtained during Ca2+ readdition. C, mean rates of Ca2+-sensitive fluorescence changes during the initial phase of reentry. *, statistically significant difference (p < 0.05) versus the single, migrating phenotype. D, TRPC4 immunofluorescence images of single (migrating; left), subconfluent contact-forming (proliferating; center), and confluent (quiescent; right) HMEC-1 cells (nuclei stained by 4′,6-diamidino-2-phenylindole). The arrows indicate positions of enhanced TRPC4 immunofluorescence. Scale bars, 10 μm.
FIGURE 3.
FIGURE 3.
Formation of immature cell-cell contacts in proliferating HMEC-1 enables TRPC4-dependent Ca2+ entry. A, Ca2+ entry into thrombin or EGF-stimulated single HMEC-1 cells. Left, representative recordings of fluo-4 fluorescence intensity in single cells transfected with pcDNA3-vector (control; open circles), TRPC4 (closed circles), or a functional dominant negative TRPC4 fragment (DNTRPC; squares). Time courses during acute stimulation with 0.5 unit/ml thrombin (arrow) and Ca2+ readdition (2 mm) are shown. Center, mean values of peak fluo-4 intensity (n > 6; open columns, control; hatched columns, TRPC4; filled columns, DNTRPC). Right, mean increases in fura-2 fluorescence ratios (n ≥ 6) obtained during Ca2+ readdition after stimulation with EGF (100 ng/ml). B, left, representative recordings of fura-2 fluorescence ratios in the subconfluent, contact-forming state is shown for controls (sham-transfected; open circles) and DNTRPC-transfected (closed circles) cells, HMEC-1 cells were challenged with EGF (100 ng/ml; arrow), as indicated. Right, increases in fura-2 fluorescence ratios (mean ± S.E.; n ≥ 8). C, left, representative recordings of fura-2 fluorescence ratios in the confluent, barrier-forming state is shown for controls (sham-transfected; open circles) and DNTRPC-transfected (closed circles) cells, and HMEC-1 cells were challenged with EGF (100 ng/ml; arrow), as indicated. Right, increases in fura-2 fluorescence ratios (mean ± S.E.; n ≥ 8).
FIGURE 4.
FIGURE 4.
Association of VE-cadherin and β-catenin with TRPC4 depends on cell-cell contact formation. A, top, TRPC4 was detected in total cell lysates (from the left, lanes 1 and 4) immunocomplexes precipitated with anti-VE-cadherin (lanes 2, 3, 5, and 6) and lysates precipitated only with beads (lane 7). Results are a representative of four experiments. Bottom, mean values ± S.E. of the TRPC4 immunoreactivity detected in precipitates obtained from cells before and after stimulation with EGF (100 ng/ml, 20 min). B, top, TRPC4 was detected in total cell lysates (from the left, lanes 1 and 4), immunocomplexes precipitated with anti-β-catenin (lanes 2, 3, 5, and 6), and lysates precipitated only with beads (lane 7). Results are a representative of four experiments. Bottom, mean values ± S.E. of the TRPC4 immunoreactivity detected in precipitates obtained from cells before and after stimulation with EGF (100 ng/ml, 20 min). * and #, statistically significant differences (p < 0.05) between stimulated versus unstimulated cells and subconfluent state versus confluent state, respectively. IP, immunoprecipitation.
FIGURE 5.
FIGURE 5.
Cell-cell contact formation and β-catenin expression determines the cellular targeting of TRPC4. Fluorescence images of single (top images) or contact-forming (bottom images) HMEC-1 (A and B) and HEK293 (C and D) cells transfected with either CFP-TRPC4 (red) or GFP-β-catenin (green) alone (A and C) or double transfected with both constructs (B and D). The arrows indicate enhanced fluorescence of CFP-TRPC4 or GFP-β-catenin, respectively. A, fluorescence images of single transfected (single TF) HMEC-1 cells. B, fluorescence images of double transfected (double TF) HMEC-1 cells. C, fluorescence images of single transfected HEK293-cells. D, fluorescence images of double transfected HEK293 cells. Images from cells expressing GFP and CFP have been normalized for channel bleed-through by linear spectral unmixing. Scale bars, 10 μm. For B and D, relative values of fluorescence overlap as a measure for co-localization are shown for defined cellular regions (total cell, nuclear region, and cell-cell contact area). The columns represent the overlap of the two fluorophores (percentage of pixels) within selected cellular areas (mean ± S.E.).
FIGURE 6.
FIGURE 6.
Interaction between TRPC4 and VE-cadherin within cell-cell contacts in the HEK293 expression system. This figure shows donor (CFP), acceptor (YFP), and raw FRET images as well as a color-coded map of FRET intensity (FRET index) after background subtraction. A, FRET analysis of CFP-TRPC4 and GFP-β-catenin transiently expressed in HEK293 cells. B, FRET analysis of CFP-TRPC4 and YFP-VE-cadherin transiently expressed in HEK293 cells. The arrows indicate enhanced FRET signal at cell-cell contact positions and cell-cell junctions. Images are representative of 14–19 individual FRET measurements.
FIGURE 7.
FIGURE 7.
β-catenin enables cell-cell contact-dependent promotion of Ca2+ entry into TRPC4-expressing HEK293 cells. Ca2+ entry into thrombin-stimulated HEK293 cells during a typical Ca2+ readdition protocol. A, representative recordings of fura-2 fluorescence ratios from single or contact-forming HEK293 cells stably expressing TRPC4 (T4-60), transfected with either pcDNA3 (control) or β-catenin. Ca2+ readdition (from nominally free to 2 mm) was performed as indicated after a 5-min stimulation with thrombin (0.5 unit/ml; pretreatment). Shown are mean peak increases in fura-2 fluorescence ratios (Δ values ± S.E.) obtained during Ca2+ readdition to single or contact-forming T4-60 (B) as well as HEK293 cells (C). *, statistical significance (p < 0.05) versus contact-forming controls as well as single cells. WT, wild type.
FIGURE 8.
FIGURE 8.
Proposed model of phenotype-dependent TRPC4 function in growth factor-stimulated endothelial cells via interaction of the channel with β-catenin and targeting into cell-cell contacts. TRPC4 is for a large part sequestered in intracellular compartments and unavailable for Ca2+ signaling in single cells (contact deficient; upper left). By contrast, formation of immature cell adhesions promotes surface targeting of β-catenin-TRPC4 complexes and enables further recruitment of channels into the plasma membrane and Ca2+ entry function (immature contact; upper right). Once mature barriers are formed (mature contact; lower panel), TRPC4 resides for a large part in junctional complexes that are rapidly retrieved from the cell surface during growth factor stimulation and are barely available for contribution to global Ca2+ signaling.

Similar articles

Cited by

References

    1. Wakabayashi I., Poteser M., Groschner K. (2006) J. Vasc. Res. 43, 238–250 - PubMed
    1. Freichel M., Suh S. H., Pfeifer A., Schweig U., Trost C., Weissgerber P., Biel M., Philipp S., Freise D., Droogmans G., Hofmann F., Flockerzi V., Nilius B. (2001) Nat. Cell Biol. 3, 121–127 - PubMed
    1. Tiruppathi C., Freichel M., Vogel S. M., Paria B. C., Mehta D., Flockerzi V., Malik A. B. (2002) Circ. Res. 91, 70–76 - PubMed
    1. Cioffi D. L., Stevens T. (2006) Microcirculation 13, 709–723 - PubMed
    1. Abdullaev I. F., Bisaillon J. M., Potier M., Gonzalez J. C., Motiani R. K., Trebak M. (2008) Circ. Res. 103, 1289–1299 - PMC - PubMed

Publication types

MeSH terms