. 2009 Dec 15;88(11):1303-11.
doi: 10.1097/TP.0b013e3181bbee98.

The human "Treg MLR": immune monitoring for FOXP3+ T regulatory cell generation

Affiliations

The human "Treg MLR": immune monitoring for FOXP3+ T regulatory cell generation

Josh Levitsky et al. Transplantation. .

Abstract

Background: Controversy exists about the conditions effecting the development of forkhead/winghead helix transcription factor P3 (FOXP3) expressing T cells and their relevance in transplant recipients.

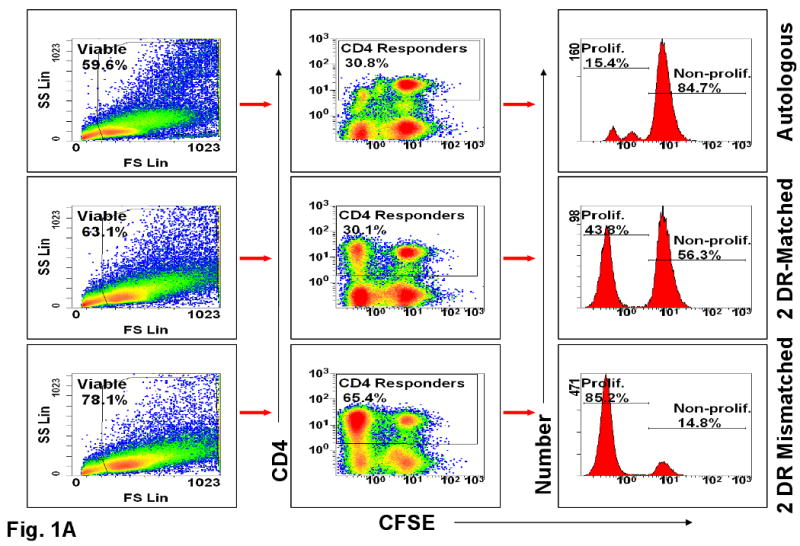
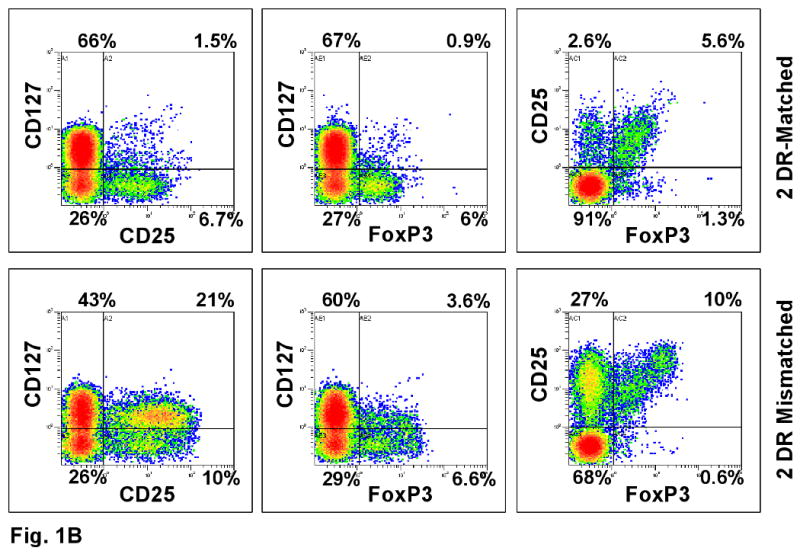
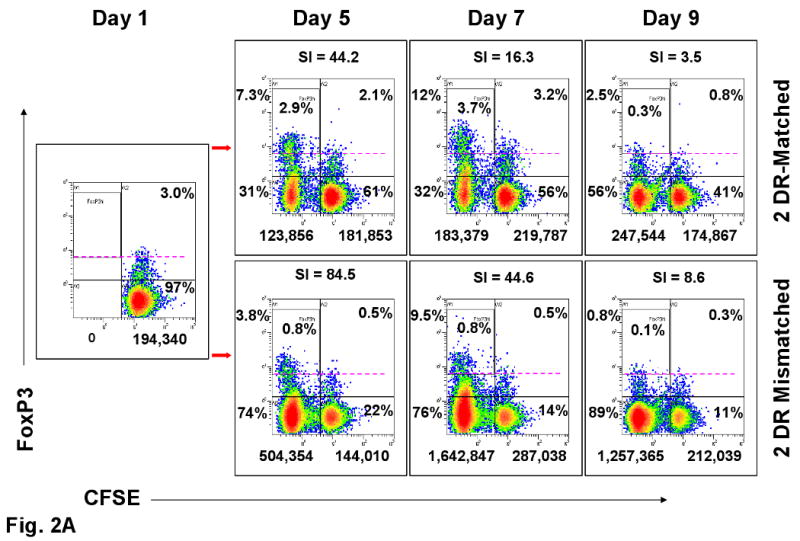
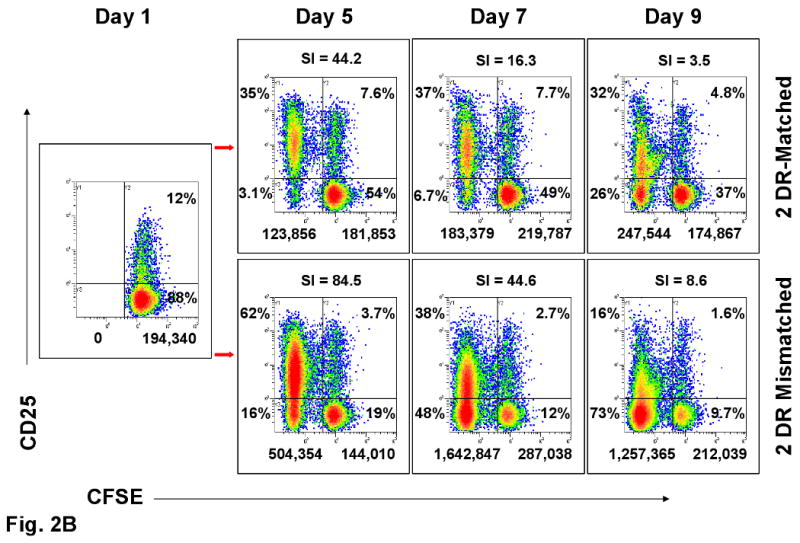
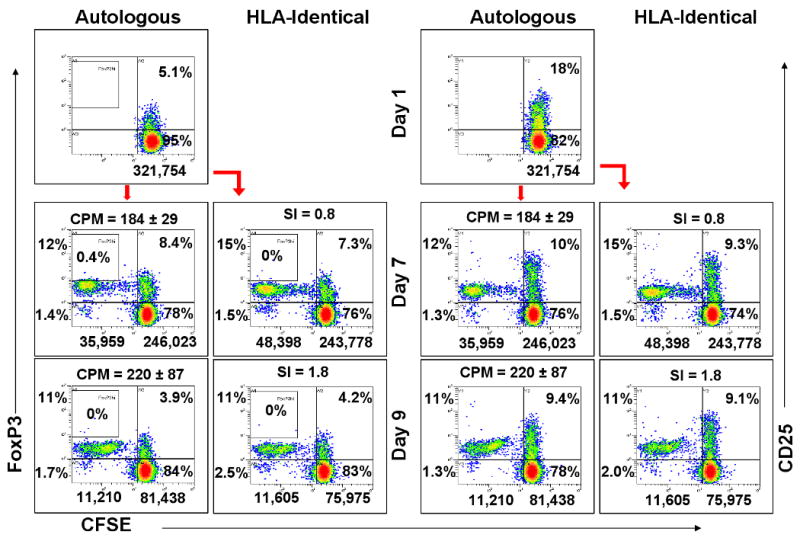
Methods: We generated carboxy-fluorescein diacetate succinimidyl ester-labeled CD4+CD25 high FOXP3+ cells in mixed lymphocyte reactions (MLRs) ("the Treg MLR"), with varying human leukocyte antigen (HLA) disparities and cell components. Five color flow cytometry and H-thymidine uptakes were the readouts.

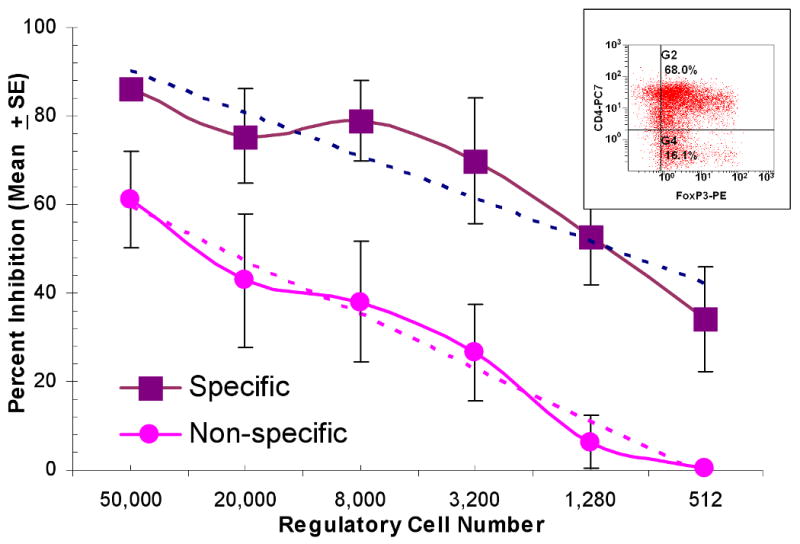
Results: (1) Despite lower stimulation indices (SIs) than two DR-mismatched MLRs, 2 DR-matched MLRs generated more than twofold higher percentages when gating on proliferating CD4+CD25 high FOXP3+ cells; (2) Even with low numbers of proliferating cells, autologous and HLA identical MLRs generated the highest FOXP3+:FOXP3- cell ratios; (3) Elimination of either non-CD3+ responding cells (resulting in "direct presentation" only) or responding CD25+ (Treg generating) cells increased the SI but inhibited proliferating CD4+CD25 high FOXP3+ cell development; (4) MLR-generated CD4+CD25 high FOXP3+ cells added as third components specifically inhibited the same freshly set MLR SI and caused recruitment of new CD4+CD25 high FOXP3+ cells. As an example of the "Treg MLR" immune monitoring potential, addition of third component peripheral blood mononuclear cell containing high percentages of CD4+CD25 high FOXP3+ cells from an HLA identical kidney transplant recipient (in a tolerance protocol) caused donor-specific Treg MLR inhibition or recruitment. This was similar to the third component MLR Tregs generated entirely in vitro.

Conclusion: In the Treg MLR, the generation of CD4+CD25 high FOXP3+ cells is more pronounced in the context of self-recognition (HLA matching, indirect presentation). These cells can be assayed for MLR inhibitory and Treg recruitment functions, so as to immunologically monitor the allospecific regulation after transplantation.


Figures

Figure 1
Figure 1. Scheme of flow analysis of a representative experiment (day 7 shown here)
(A) Viable cells were gated again on CD4+ cells that were either non-proliferating (CFSE high cells labeled as Non-Prolif.) or proliferating (CFSE low cells labeled as Prolif.). Cells were analyzed by dot blots and histograms. CFSE negative stimulator cells were gated out. The percentages inside the boxes of the middle column represent gated fractions of cells in each culture. (B) The gated CD4 responder cells from DR-identical vs. 2 DR mismatched MLR cultures were further analyzed for their CD127, CD25 and FOXP3 expressions. Note the lower CD127 values in the 2 DR matched pairs expressing either CD25 or FOXP3 (right upper quadrant).
Figure 2
Figure 2. Assessment of Tregs in MLR (representative experiment of 8 performed)
(A) FOXP3 and (B) CD25 expression in CFSE labeled proliferating and non-proliferating CD4+ responder cells (see Figure 1A) on indicated days in culture. The numbers below the dot-plots indicate the absolute cell numbers that were proliferating (left of the vertical bar) and non-proliferating (right of the vertical bar) when 1×10⁶ total responding PBMC were placed in culture on day 0. The percentages indicate the distribution within the four quadrants. The dashed lines in A and percentages within the boxes are arbitrary to aid in visualizing the high intensity FOXP3+ cells. All other dot plots are compared to day one in culture when CFSE labeling did not show any proliferation (far left box with arrows directed to the other panels). On top of the dot-plots are the SIs obtained when calculated in parallel using the baseline triplicate CPM ± SD of the autologous cultures. The 2 DR mismatched responses had higher SI and overall numbers of CFSE labeled proliferating cells (left upper and lower quadrants of each dot blot), but there were either consistently lower percentages or positive : negative ratios of FOXP3+ and CD25+ cells than with the DR-identical responses.
Figure 3
Figure 3. CD4+CD25+FOXP3+ cell generation in HLA-Identical vs. autologous MLRs (representative of 4 similar experiments-donor vs. recipient and recipient vs. donor)
1×10⁶ CFSE labeled responding PBMC from the pre-renal transplant recipient were cultured with 1×10⁶ autologous or HLA-identical donor irradiated stimulator cells. On indicated days the expression of FOXP3+ (left boxes) or CD25+ (right boxes) was measured in the responder CD4+ cells by flow cytometric analysis using the scheme shown in Fig. 2A. Note the overall low number of proliferating cells (left of the vertical bars) but the higher FOXP3 positive to negative ratios generated compared with the 2 DR matched or mismatched pairs (Figure 2).
Figure 4
Figure 4. Assessment of inhibitory functions of putative Tregs in MLR
Bulk cultures of 4 pairs of responder cells stimulated with DR-matched x-irradiated stimulator cells were prepared as described in the Methods section. The insert shows that the purified CD127- CD25+ cells were predominantly FOXP3+. These were added to 1×10⁵ autologous fresh responding and x-irradiated stimulator PBMC, the latter from the original 2 DR matched (specific) or a 2 DR-mismatched (non-specific) volunteer donor. Control cultures were prepared as described in the Methods section with fresh autologous total PBMC from the responder (rather than the Tregs). After another seven days, 3H-TdR assays demonstrated significant differences between the specific vs. non-specific inhibition (p<0.001) in that inhibition disappeared at lower modulator numbers in the non-specific combinations. There was equivalent (lack of) inhibition using either unirradiated (n=2) or x-irradiated (n=2) fresh PBMC as the third component controls.

References

    1. Sakaguchi S. Naturally arising Foxp3-expressing CD25+CD4+ regulatory T cells in immunological tolerance to self and non-self. Nat Immunol. 2005;6(4):345. - PubMed
    1. Battaglia M, Stabilini A, Migliavacca B, Horejs-Hoeck J, Kaupper T, Roncarolo MG. Rapamycin promotes expansion of functional CD4+CD25+FOXP3+ regulatory T cells of both healthy subjects and type 1 diabetic patients. J Immunol. 2006;177(12):8338. - PubMed
    1. Pillai V, Ortega SB, Wang CK, Karandikar NJ. Transient regulatory T-cells: a state attained by all activated human T-cells. Clin Immunol. 2007;123(1):18. - PMC - PubMed
    1. Tang Q, Bluestone JA. The Foxp3+ regulatory T cell: a jack of all trades, master of regulation. Nat Immunol. 2008;9(3):239. - PMC - PubMed
    1. Fathman CG, Collavo D, Davies S, Nabholz M. In vitro secondary MLR. I. Kinetics of proliferation and specificity of in vitro primed responder cells. J Immunol. 1977;118(4):1232. - PubMed

Publication types