. 2010 Jan;112(1):153-64.
doi: 10.1097/ALN.0b013e3181c2952e.

Guarding pain and spontaneous activity of nociceptors after skin versus skin plus deep tissue incision

Affiliations

Guarding pain and spontaneous activity of nociceptors after skin versus skin plus deep tissue incision

Jun Xu et al. Anesthesiology. 2010 Jan.

Abstract

Background: Guarding pain after rat plantar incision is similar to pain at rest in postoperative patients. Spontaneous activity (SA) in nociceptive pathways quite likely transmits such ongoing pain. This study examined the extent of tissue injury by incision on pain behaviors and nociceptor SA.

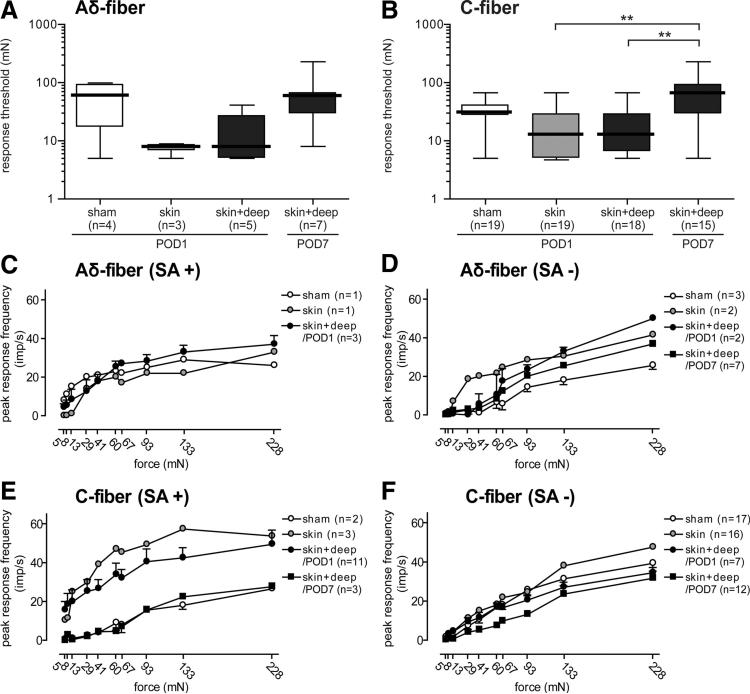
Methods: Rat pain behaviors were measured after a sham procedure, skin incision, or skin plus deep tissue incision. Separate groups of rats underwent in vivo single-fiber recording 1 day after a sham procedure, skin, or skin plus deep tissue incision or 7 days after skin plus deep tissue incision.

Results: Compared with the control procedure, skin incision induced moderate guarding on the day of incision only, whereas skin plus deep tissue incision caused guarding for 5 days. Mechanical and heat hyperalgesia were similar in both incised groups, except that mechanical hyperalgesia lasted longer after skin plus deep tissue incision. On Postoperative Day 1, skin incision (18.2%) produced a similar prevalence of SA in nociceptors as in controls (13.0%), whereas skin plus deep tissue incision generated a greater prevalence of SA (61.0%); SA rate also tended to be greater (6.1 vs. 10.0 imp/s) after skin plus deep tissue incision. Seven days after skin plus deep tissue incision, the SA prevalence was similar (13.6%) as in controls.

Conclusions: These data demonstrated that incised deep tissue rather than skin had a central role in the genesis of guarding behavior and nociceptor SA. Understanding the responses of deep tissue to incision and the mechanisms for deep tissue pain will improve postoperative pain management.


Figures

Fig. 1
Fig. 1
Pain behaviors of rats with sham procedure, skin, or skin plus deep tissue incision. (A) Guarding pain behavior measured during a 60-min test period. The results are presented as mean and SEM. Two-way ANOVA (interaction factor: F18,210 = 11.5, P < 0.0001) followed by separate one-way ANOVAs with Tukey post hoc test for comparing the mean cumulative pain score at each time point among groups (2 h: F2,21 = 50.0, P < 0.0001; 1 day: F2,21 = 18.9, P < 0.0001; 2 days: F2,21 = 36.3, P < 0.0001; 3 days: F2,21 = 10.6, P = 0.0006; 4 days: F2,21 = 8.3, P = 0.0022; 5 days: F2,21 = 6.8, P = 0.0051; 6 days: F2,21 = 2.6, P = 0.1016; 7 days: F2,21 = 2.4, P = 0.1163). (B) Withdrawal threshold to von Frey filament application. The results are presented as median with interquartile range. Friedman test (Fr = 15.2, P < 0.0001) followed by Kruskal-Wallis test with Dunn post hoc test for between-group comparisons at each time point (2 h: KW2,21 statistic = 19.1, P < 0.0001; 1 day: KW2,21 statistic = 18.3, P < 0.0001; 2 days: KW2,21 statistic = 16.7, P = 0.0002; 3 days: KW2,21 statistic = 21.0, P < 0.0001; 4 days: KW2,21 statistic = 18.2, P = 0.0001; 5 days: KW2,21 statistic = 12.0, P = 0.0024; 6 days: KW2,21 statistic = 6.5, P = 0.038; 7 days: KW2,21 statistic = 2.0, P = 0.37). (C) Withdrawal latency to heat stimulation. The results are presented as mean and SEM. Two-way ANOVA (interaction factor: F18,210 = 11.5, P < 0.0001) followed by separate one-way ANOVA with Tukey post hoc test for comparing the mean withdrawal latency at each time point among groups (2 h: F2,21 = 170.3, P < 0.0001; 1 day: F2,21 = 152.2, P < 0.0001; 2 days: F2,21 = 100.6, P < 0.0001; 3 days: F2,21 = 31.6, P < 0.0001; 4 days: F2,21 = 33.8, P < 0.0001; 5 days: F2,21 = 8.7, P = 0.0018; 6 days: F2,21 = 3.6, P = 0.0463; 7 days: F2,21 = 2.0, P = 0.1577). * P < 0.5, ** P < 0.01, *** P < 0.001 versus sham, † P < 0.5, †† P < 0.01, ††† P < 0.001 versus skin incision.
Fig. 2
Fig. 2
Pain behaviors of the rats that underwent electrophysiological studies. (A) Guarding pain behavior measured during a 30-min period. The results are presented as mean and SEM. One-way ANOVA (F3,23 = 12.2, P < 0.0001) with Tukey post hoc test. (B) Withdrawal threshold to von Frey filament application. The results are expressed as median (thick horizontal line) with 1st and 3rd quartiles (box) and 10th and 90th percentiles (thin horizontal lines). Kruskal-Wallis test (KW3,23 statistic = 21.0, P = 0.0001) with Dunn post hoc test. (C) Withdrawal latency to heat stimulation. The results are presented as mean and SEM. One-way ANOVA (F3,23 = 31.5, P < 0.0001) with Tukey post hoc test. POD = postoperative day. * P < 0.5, ** P < 0.01, *** P < 0.001.
Fig. 3
Fig. 3
Nociceptor conduction velocities. Example of digitized oscilloscope trace of action potentials evoked by electrical stimulation at the receptive field of an Aδ-(A) and C-nociceptor (B). Open arrow head, electrical stimulation; filled arrow, evoked action potential. The distribution of conduction velocities of each Aδ-(C) and C-nociceptor (D) in each of the four groups. Open circle, nociceptors without spontaneous activity; filled circle, nociceptors with spontaneous activity. POD = postoperative day.
Fig. 4
Fig. 4
Spontaneous activity of nociceptors 1 day after sham procedure, skin, or skin plus deep tissue incision and 7 days after skin plus deep tissue incision. (A) Digitized oscilloscope trace of spontaneous action potentials of a C-nociceptor from a rat 1 day after skin plus deep tissue incision. Inset shows a representative single action potential. (B) Percentage of nociceptors with spontaneous activity in each of the four groups. Chi-square test with Bonferroni post hoc correction for comparisons among groups. (C) Comparison of average spontaneous activity rates among groups. POD = postoperative day; Imp = impulse. * P < 0.5, ** P < 0.01.
Fig. 5
Fig. 5
Example recordings of responses of primary nociceptors to mechanical stimulation. Digitized oscilloscope trace of action potentials evoked by von Frey filaments in the sham control (A), skin incision (B), skin plus deep tissue incision (POD1) (C), and skin plus deep tissue incision (POD7) (D) group. POD = postoperative day.
Fig. 6
Fig. 6
Summary of mechanical responses of nociceptors in four groups of rats. Comparison of mechanical response thresholds of Aδ-(A)or C-nociceptors (B) among the sham control, skin, skin plus deep tissue (POD1), and skin plus deep tissue (POD7) group. The results are presented as median (thick horizontal line) with 1st and 3rd quartiles (box) and 10th and 90th percentiles (thin horizontal line). Kruskal-Wallis test (KW3,67 statistic = 13.7, P = 0.0033) with Dunn post hoc test for comparisons among groups. ** P < 0.01 versus the skin plus deep tissue incision group. Comparison of peak response frequency to von Frey filaments of Aδ-nociceptors with spontaneous activity (C) and without spontaneous activity (D) and C-nociceptors with spontaneous activity (E) and without spontaneous activity (F). Error bars (SEM) are shown for the sham control group and the skin plus deep tissue incision (POD1) group. Two-way ANOVA followed by separate one-way ANOVA with Tukey post hoc test for comparing effects of groups at each force. SA = spontaneous activity; POD = postoperative day; Imp = impulse.
Fig. 7
Fig. 7
Mechanical receptive field area of nociceptors. Schematic diagrams of receptive field of Aδ-(A) or C-nociceptors (B) from the sham control, skin incision, skin plus deep tissue incision (POD1), and skin plus deep tissue incision (POD7) group. The dark area depicts the region responsive to the von Frey filament with a 240-mN bending force. The vertical line on the paw represents the location of the incision. The relative size of receptive field area of Aδ-(C)or C-nociceptors (D) from each group. The receptive field areas of the skin, skin plus deep tissue incision (POD1), and skin plus deep tissue incision (POD7) groups are normalized to the receptive field area of the sham control group. The results are expressed as mean and SEM. One-way ANOVA (F3,67 = 18.5, P < 0.0001) with Tukey post hoc test for comparisons among groups. ** P < 0.01, *** P < 0.001 versus skin plus deep tissue incision. POD = postoperative day.
Fig. 8
Fig. 8
Schematic diagrams of the hypothesis that injured deep tissue rather than skin induces spontaneous activity in the nociceptive pathways. (A) An incision in skin only (epidermis and dermis) induces minimal spontaneous activity in nociceptors and dorsal horn neurons, which receive cutaneous input. (B) An incision including skin and deep tissue (fascia and muscle) produces robust spontaneous activity in muscle-innervating nociceptors and the dorsal horn neurons receiving input from the muscle.

References

    1. Bessou P, Perl ER. Response of cutaneous sensory units with unmyelinated fibers to noxious stimuli. J Neurophysiol. 1969;32:1025–43. - PubMed
    1. Burgess PR, Perl ER. Myelinated afferent fibres responding specifically to noxious stimulation of the skin. J Physiol. 1967;190:541–62. - PMC - PubMed
    1. Hamalainen MM, Gebhart GF, Brennan TJ. Acute effect of an incision on mechanosensitive afferents in the plantar rat hindpaw. J Neurophysiol. 2002;87:712–20. - PubMed
    1. Brennan TJ, Vandermeulen EP, Gebhart GF. Characterization of a rat model of incisional pain. Pain. 1996;64:493–501. - PubMed
    1. Brennan TJ, Zahn PK, Pogatzki-Zahn EM. Mechanisms of incisional pain. Anesthesiol Clin North America. 2005;23:1–20. - PubMed

Publication types

MeSH terms