. 2009 Nov 23;17(24):21634-51.
doi: 10.1364/OE.17.021634.

Retinal imaging with polarization-sensitive optical coherence tomography and adaptive optics

Affiliations

Retinal imaging with polarization-sensitive optical coherence tomography and adaptive optics

Barry Cense et al. Opt Express. .

Abstract

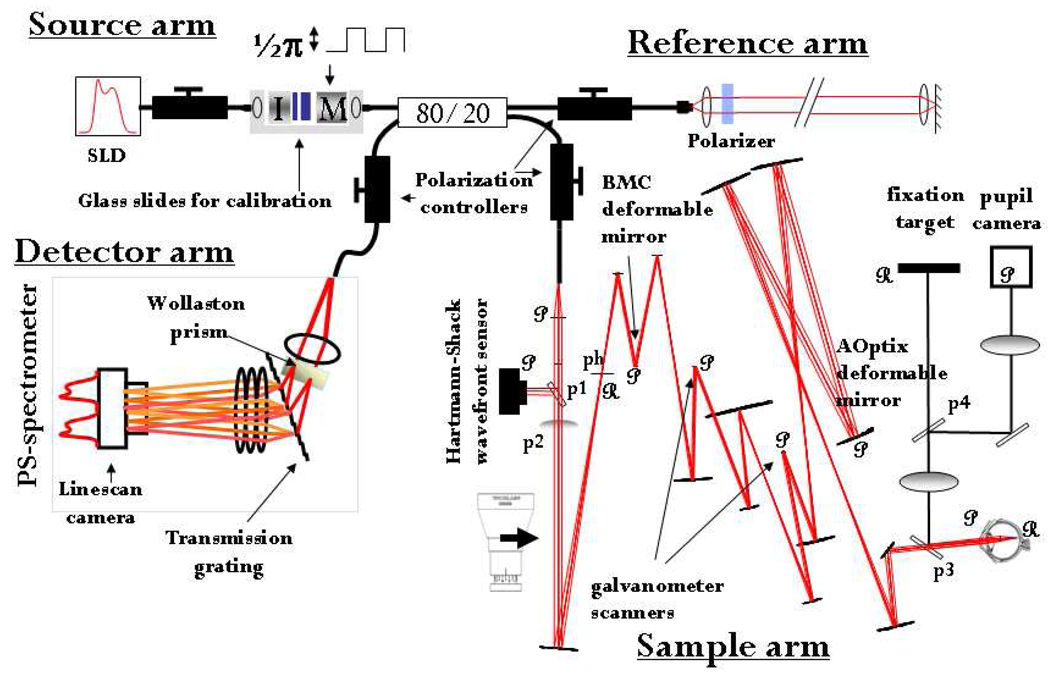
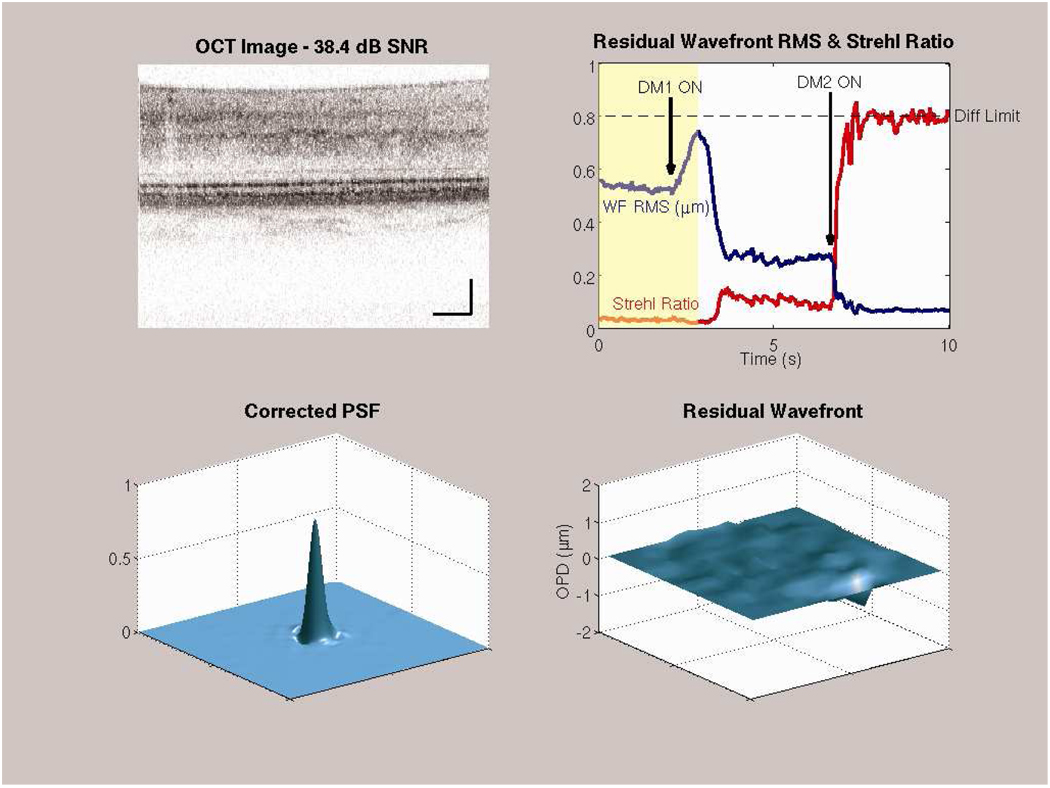
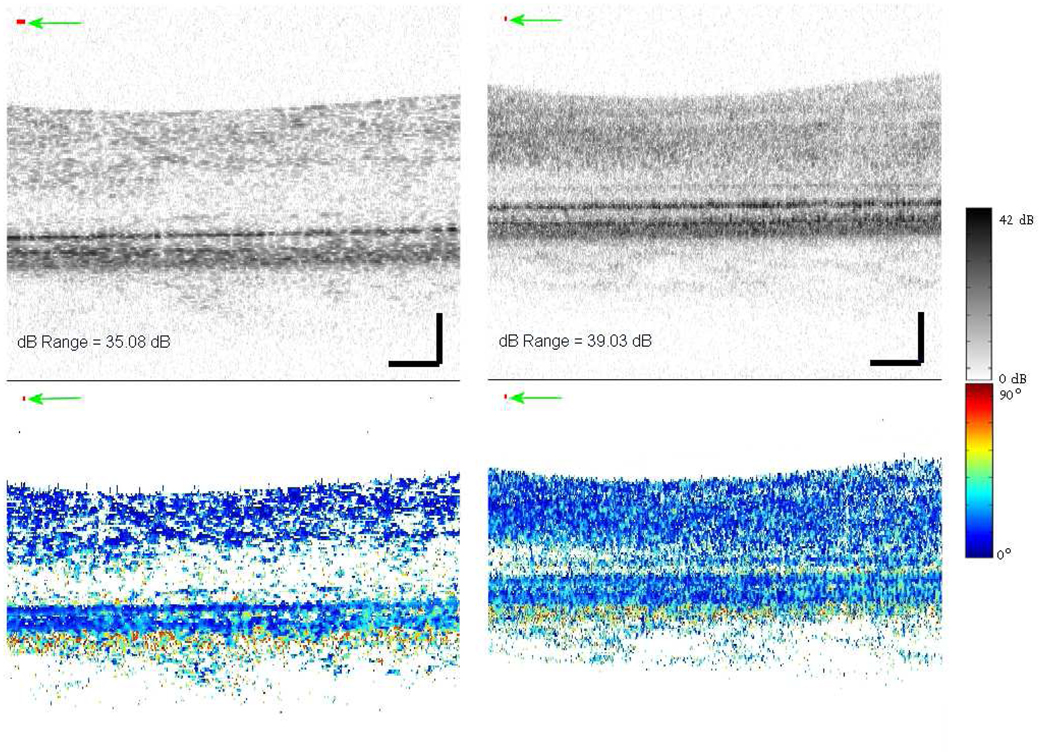
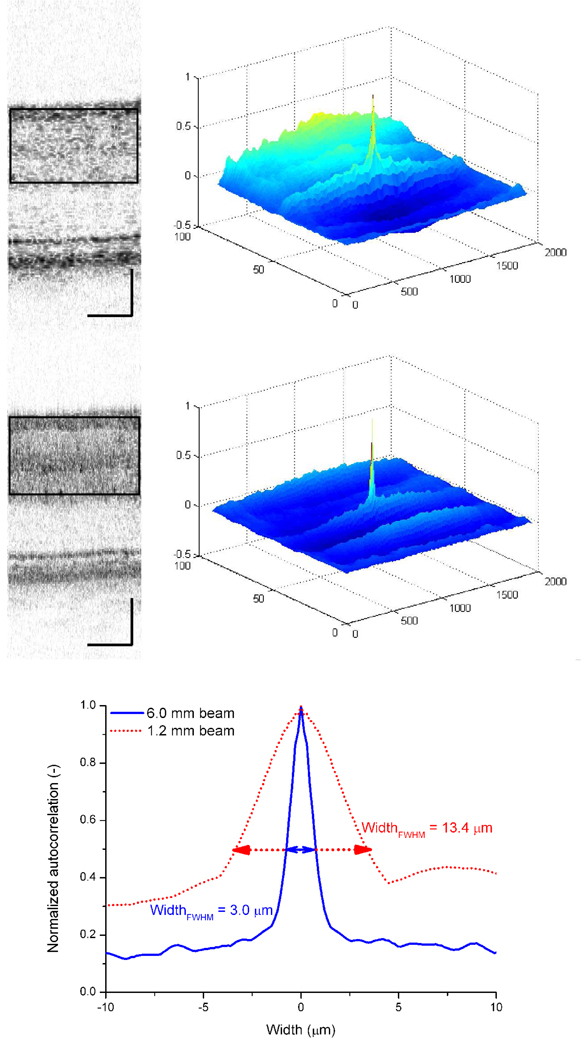
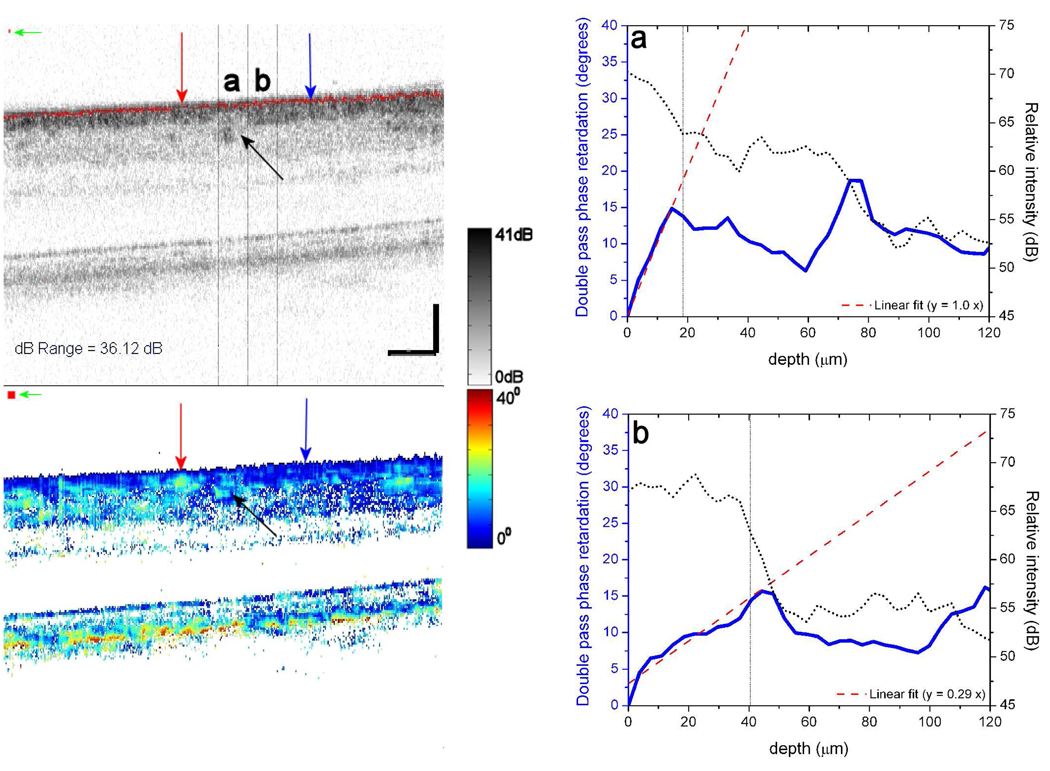
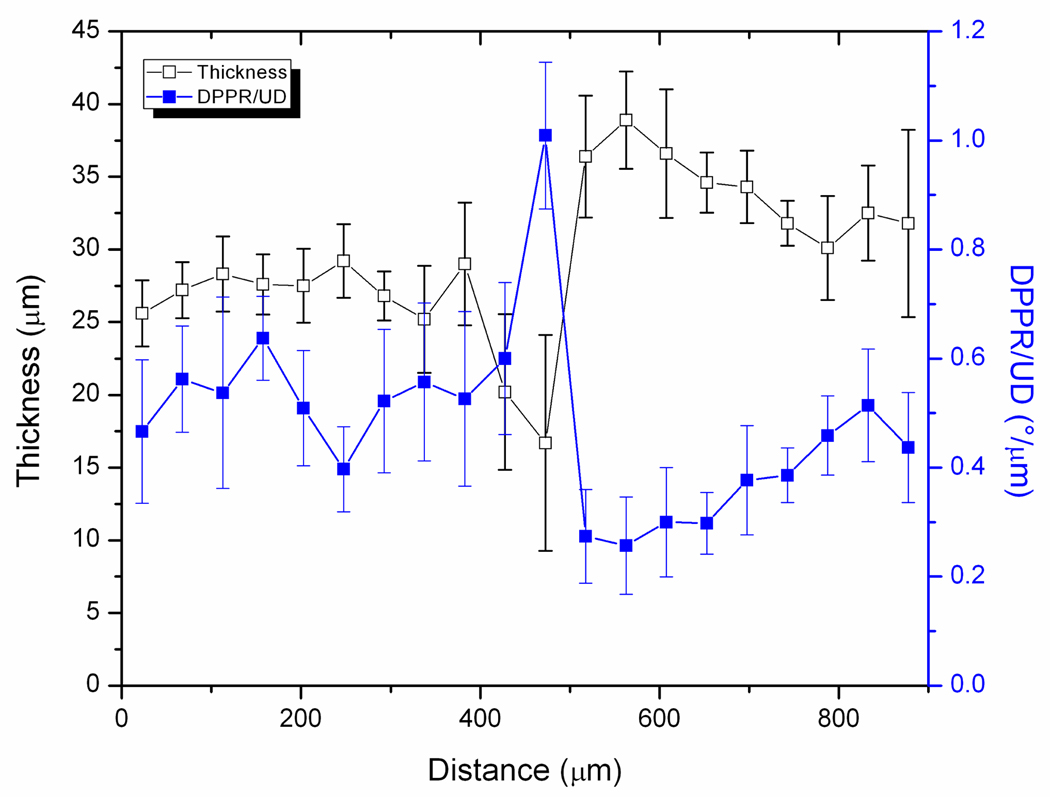
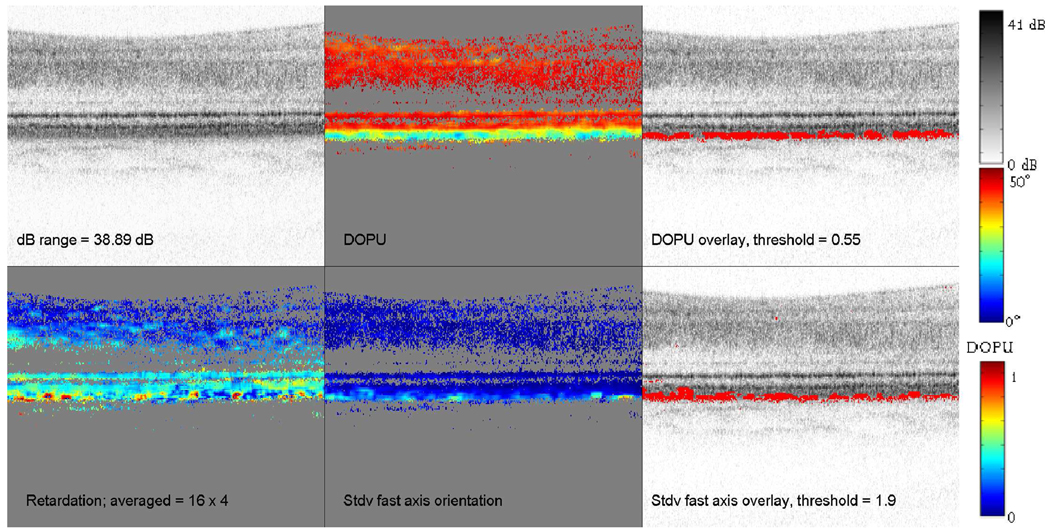
Various layers of the retina are well known to alter the polarization state of light. Such changes in polarization may be a sensitive indicator of tissue structure and function, and as such have gained increased clinical attention. Here we demonstrate a polarization-sensitive optical coherence tomography (PS-OCT) system that incorporates adaptive optics (AO) in the sample arm and a single line scan camera in the detection arm. We quantify the benefit of AO for PS-OCT in terms of signal-to-noise, lateral resolution, and speckle size. Double pass phase retardation per unit depth values ranging from 0.25 degrees/microm to 0.65 degrees/microm were found in the birefringent nerve fiber layer at 6 degrees eccentricity, superior to the fovea, with the highest values being noticeably higher than previously reported with PS-OCT around the optic nerve head. Moreover, fast axis orientation and degree of polarization uniformity measurements made with AO-PS-OCT demonstrate polarization scrambling in the retinal pigment epithelium at the highest resolution reported to date.


Figures

Fig. 1
Fig. 1
Setup for polarization-sensitive OCT with AO. SLD: superluminescent diode; I: isolator; M: polarization modulator; P1– P4: pellicle beam splitters; ph: pinhole; P/R: relevant pupil and retinal planes. A 5× beam expander could be positioned in the beam path to reduce the beam width to 1.2 mm.
Fig. 2
Fig. 2
OCT retinal image (top left), RMS of residual wavefront aberrations & Strehl ratio (top right), point spread function (bottom left) and residual wavefront aberrations (bottom right) as a function of time. Prior to AO compensation, the OCT image is dim and of poor quality, and the Strehl ratio is low. Note that not all centroids of the SHWS were measurable during the first ~3 seconds as the large aberrations (primarily from −4.75 D of sphere corresponding to a wavefront RMS of approximately 3.5 µm RMS) were beyond the dynamic range of the sensor. As such, the reported residual wavefront RMS, Strehl ratio and corrected PSF overestimate actual image quality during this interval, which is demarcated by the yellow background in the upper right panel. Using the AOptix mirror, both the OCT image quality and the Strehl ratio improve, and the diffraction limit (Strehl > 0.8) is reached when the loop for the BMC deformable mirror is closed. (Media 1)
Fig. 3
Fig. 3
Intensity (top) and corresponding double pass phase retardation (bottom) images taken at 1 degree eccentricity, without (left, 1.2 mm beam (Media 2)) and with (right, 6.0 mm beam (Media 3)) AO. The right image was taken with the focus of the AOptix mirror near the inner plexiform layer. Data was scaled in the vertical direction assuming an index of refraction of 1.38 and scale bars indicate a length of 100 µm. The intensity displays 42 dB of signal above the noise floor (white) encoded over 256 gray values. The cumulative double pass phase retardation images are color coded over 90 degrees, with blue representing 0° and red representing 90°. By clicking on the images, a movie covering ~4.4 s of data acquisition will be shown. The Stokes vectors were moving averaged over 2 × 2 pixels, corresponding to 2 µm × 7 µm, to reduce the influence of speckle noise. In the intensity images, the size of the red block (follow green arrow) represents the footprint (width × depth) of the AO-OCT point spread function at the plane of focus as well as the mean speckle size throughout the entire retina. In the DPPR image, the red block represents the 2 µm × 7 µm averaging kernel.
Fig. 4
Fig. 4
Upper left: B-scan of 1000 A-scans taken with a 1.2 mm beam. Upper right: three dimensional autocorrelation plot of the area demarcated by a thin black line in the B-scan. Middle left: B-scan of 1000 A-scans taken with a 6.0 mm beam and AO. Only the upper retinal layers were included in the analysis, because the autocorrelation algorithm was sensitive to abrupt changes in intensity. Focus of the AOptix mirror for the bottom image was near the outer plexiform layer. The three dimensional autocorrelation plot of the demarcated area in the B-scan is given in the middle right image. The autocorrelation plots for a 1.2 mm and 6.0 mm beam are shown in the bottom graph.
Fig. 5
Fig. 5
Intensity (top left) and cumulative double pass phase retardation (bottom left) obtained with AO-PS-OCT. 3° B-scan bisects the nasal/temporal retina with the left and right edges at 4.5° and 7.5° superior of the foveal center, respectively. RNFL birefringence causes the cumulative double pass phase retardation to increase from 0° (dark blue) to approximately 30° (light blue / green) over a depth of less than 50 µm. The red and blue arrows point to RNFL regions that exhibit high and low birefringence, respectively. Distance between these regions of extreme RNFL birefringence is just 200 µm. The black arrow points to a 70 µm wide small blood vessel that was identified as arterial. Large changes in phase retardation spanning more than 50° is evident in the RPE and is suggestive of rapid changes in fast axis orientation associated with polarization scrambling. In the intensity image, the size of the red block (follow green arrow) represents the footprint (width × depth) of the AO-OCT point spread function at the plane of focus as well as the mean speckle size throughout the entire retina. In the DPPR image, the red block represents the 14 µm × 14 µm averaging kernel. Data was scaled in the vertical direction assuming an index of refraction of 1.38 and scale bars indicate a length of 100 µm. The two plots on the right show data that encompasses the blood vessel (a) and data that was taken next to the vessel (b). The relative intensity and DPPR are plotted as a function of depth, with least squares fits going through DPPR data that is estimated to belong to the RNFL.
Fig. 6
Fig. 6
RNFL thickness (open black squares) and DPPR/UD (blue squares) as a function of lateral position in the B-scan of Fig. 5. Thickness and DPPR/UD were averaged over 10 data sets with error bars representing the standard deviation across the sets. Distances of 0 µm and 900 µm correspond to 4.5° and 7.5° superior of the fovea, respectively. The DPPR/UD spike of ~1°/µm originates from tissue close to a small vessel.
Fig. 7
Fig. 7
Top - intensity, DOPU (color coded from 0 (blue) to 1 (red)) and thresholded DOPU overlaid on intensity image of the retina. The data was taken at 1° eccentricity. Bottom - retardation (encoded over 50°), standard deviation of the fast axis orientation (encoded over 10°), and a thresholded standard deviation fast axis image overlaid on the intensity image.

References

    1. Quigley HA, Addicks EM, Green WR. Optic nerve damage in human glaucoma. III. Quantitative correlation of nerve fiber loss and visual field defect in glaucoma, ischemic neuropathy, papilledema, and toxic neuropathy. Arch. Ophthalmol. 1982;100(1):135–146. - PubMed
    1. Huang D, Swanson EA, Lin CP, Schuman JS, Stinson WG, Chang W, Hee MR, Flotte T, Gregory K, Puliafito CA, Fujimoto JG. Optical coherence tomography. Science. 1991;254(5035):1178–1181. - PMC - PubMed
    1. Bouma BE, Tearney GJ, editors. Handbook of Optical Coherence Tomography. New York: Marcel Dekker, Inc.; 2002.
    1. Medeiros FA, Zangwill LM, Bowd C, Weinreb RN. Comparison of the GDx VCC scanning laser polarimeter, HRT II confocal scanning laser ophthalmoscope, and stratus OCT optical coherence tomograph for the detection of glaucoma. Arch. Ophthalmol. 2004;122(6):827–837. - PubMed
    1. Wojtkowski M, Leitgeb R, Kowalczyk A, Bajraszewski T, Fercher AF. In vivo human retinal imaging by Fourier domain optical coherence tomography. J. Biomed. Opt. 2002;7(3):457–463. - PubMed

Publication types