. 2009 Dec;5(12):e1000585.
doi: 10.1371/journal.pcbi.1000585. Epub 2009 Dec 4.

Predicting protein ligand binding sites by combining evolutionary sequence conservation and 3D structure

Affiliations

Predicting protein ligand binding sites by combining evolutionary sequence conservation and 3D structure

John A Capra et al. PLoS Comput Biol. 2009 Dec.

Abstract

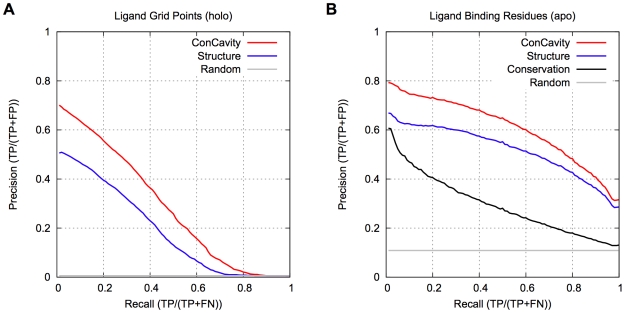
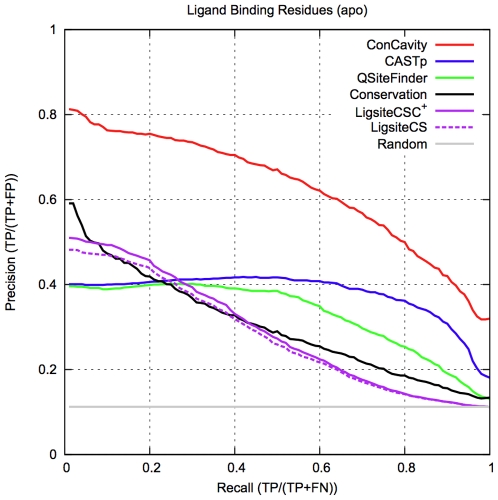
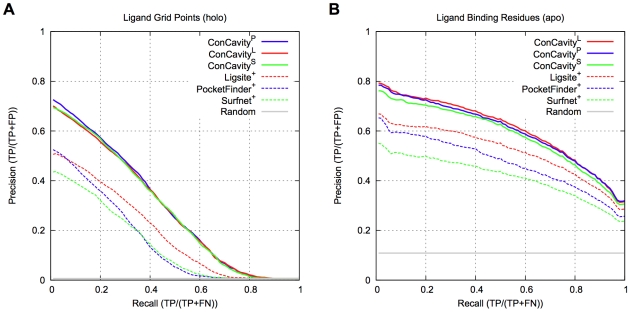
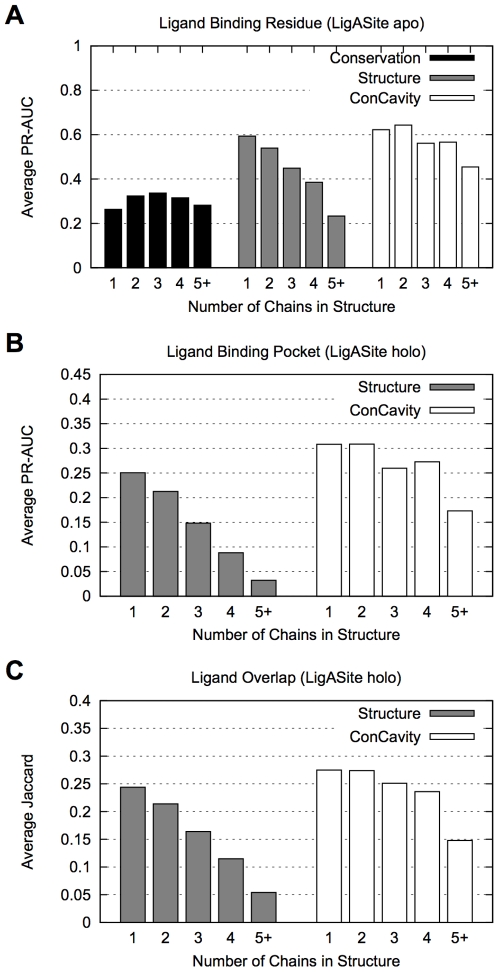
Identifying a protein's functional sites is an important step towards characterizing its molecular function. Numerous structure- and sequence-based methods have been developed for this problem. Here we introduce ConCavity, a small molecule binding site prediction algorithm that integrates evolutionary sequence conservation estimates with structure-based methods for identifying protein surface cavities. In large-scale testing on a diverse set of single- and multi-chain protein structures, we show that ConCavity substantially outperforms existing methods for identifying both 3D ligand binding pockets and individual ligand binding residues. As part of our testing, we perform one of the first direct comparisons of conservation-based and structure-based methods. We find that the two approaches provide largely complementary information, which can be combined to improve upon either approach alone. We also demonstrate that ConCavity has state-of-the-art performance in predicting catalytic sites and drug binding pockets. Overall, the algorithms and analysis presented here significantly improve our ability to identify ligand binding sites and further advance our understanding of the relationship between evolutionary sequence conservation and structural and functional attributes of proteins. Data, source code, and prediction visualizations are available on the ConCavity web site (http://compbio.cs.princeton.edu/concavity/).


Conflict of interest statement

The authors have declared that no competing interests exist.

Figures

Figure 1
Figure 1. Ligand binding site prediction performance.
(A) PR curves for prediction of the spatial location of biologically relevant bound ligands. (B) PR curves for ligand binding residue prediction. Our ConCavity algorithm, which combines sequence conservation with structure-based predictors, significantly outperforms either of the constituent methods at both tasks. Prediction based on structural information alone outperforms considering sequence conservation alone. Comparing (A) and (B), we see that accurately predicting the location of all ligand atoms is harder for the methods than finding all the contacting residues. Random gives the expected performance of a method that randomly ranks grid points and residues. Conservation could not be included in (A), because it only predicts at the residue level. The curves are based on binding sites in 332 proteins from the non-redundant LigASite 7.0 dataset.
Figure 2
Figure 2. Evolutionary sequence conservation mapped to the surface of three example proteins.
(A) Cellular retinoic acid-binding protein II (PDB: 3CWK). (B) Delta1-piperideine-2-carboxylate reductase (PDB: 2CWH). (C) Thiamin phosphate synthase (PDB: 1G6C). Warmer colors indicate greater evolutionary conservation; the most conserved residues are colored dark red, and the least conserved are colored dark blue. Ligands are rendered with yellow sticks, and protein backbone atoms are shown as spheres. In general, Conservation gives the highest scores to residues near ligands, but high scoring residues are found throughout each structure. The predictions of Structure and ConCavity for these proteins are given in Figure 3.
Figure 3
Figure 3. Comparison of the binding site predictions of Structure and ConCavity on three example proteins.
The three proteins presented here correspond to those shown in Figure 2. In each pane, ligand binding residue scores have been mapped to the protein surface. Warmer colors indicate a higher binding score. Pocket predictions are shown as green meshes. (A) PDB: 3CWK. Both methods identify the binding site, but by considering conservation information (Figure 2A), ConCavity more accurately traces the ligand. (B) PDB: 2CWH. Structure significantly overpredicts the extent of the ligand in the bottom left corner as well as predicting an additional pocket on the reverse of the protein. ConCavity predicts only the two ligand binding pockets. (C) PDB: 1G6C. In order to visualize the predictions more clearly, only the secondary structure diagram of the protein is shown. This example illustrates the difficulty presented by multichain proteins; there are many cavities in the structure, but not all bind ligands. Structure identifies some of the relevant pockets, but focuses on the large, non-binding central cavity formed between the chains. Referring to this protein's conservation profile (Figure 2C), we see that the ligand binding pockets exhibit high conservation while the non-binding pockets do not. As a result, ConCavity selects only the relevant binding pockets. In each example, ConCavity selects the binding pocket(s) out of all potential pockets and more accurately traces the ligands' locations in these pockets.
Figure 4
Figure 4. Comparison of ConCavity with publicly available ligand binding site prediction servers.
ConCavity significantly outperforms each previous method at the prediction of ligand binding residues. The existing servers focus on the task of pocket prediction, and return sets of residues that represent binding pocket predictions. They do not give different scores to these individual residues. In contrast, ConCavity assigns each residue a likelihood of binding, and thus residues in the same predicted pocket can have different scores. This ability and the direct integration of sequence conservation are the major sources of ConCavity's improvement. Conservation, the method based solely on sequence conservation, is competitive with these previous structural approaches. This figure is based on 234 proteins from the LigASite apo dataset for which we were able to obtain predictions from all methods.
Figure 5
Figure 5. Comparison of different versions of ConCavity.
ConCavity provides a general framework for binding site prediction. We use Ligsite+ -based ConCavity as representative, but it is possible to use other algorithms in ConCavity. This figure compares the PR curves for three versions (ConCavityL, ConCavityP, ConCavityS )---each based on integrating sequence conservation with a different grid creation strategy (Ligsite+, PocketFinder+, or Surfnet+). All three versions perform similarly, and all significantly outperform the methods based on structure analysis alone (dashed lines). These conclusions hold for both ligand binding pocket (A) and ligand binding residue (B) prediction.
Figure 6
Figure 6. Ligand-binding site identification performance by number of chains in structure.
(A) The average area under the precision-recall curve (PR-AUC) for predicting ligand binding residues on each set of structures. (B) The average PR-AUC for ligand binding pocket identification. (C) The average Jaccard coefficient of the overlap of the predicted pockets with bound ligands. Methods based on structure alone have an increasingly difficult time distinguishing among ligand-binding pockets and non-ligand-binding gaps between chains as the number of chains in the protein increases. This trend is clear in each evaluation. Conservation's performance does not exhibit this effect (A). In fact, Conservation outperforms Structure on proteins with five or more chains. The integration of sequence conservation and pocket prediction in ConCavity improves performance in each chain based partition in each evaluation, and ConCavity sees only a modest decrease in performance on proteins with multiple chains. Conservation alone could not be included in (B) and (C), because it does not make pocket predictions. Note that the y-axes in the figures do not all have the same scale. The number of structures per chain group: 1 chain: 143, 2 chains: 112, 3 chains: 18, 4 chains: 35, 5 or more chains: 24.
Figure 7
Figure 7. Examples of difficult structures.
For each structure, evolutionary sequence conservation has been mapped to the surface of the protein backbone (all atoms in pane (C)) with warmer colors indicating greater conservation. Bound ligands are shown in yellow, and the pocket predictions of ConCavity are represented by green meshes. (A) The ActR protein (PDB: 3B6A) contains both a ligand-binding (bottom half) and a more conserved DNA-binding domain (top half). (B) The ring-shaped pentameric B-subunit of a shiga-like toxin (PDB: 1CQF) binds globotriaosylceramide (Gb3) via a relatively flat interface that surrounds the center of the ring. (C) The carbohydrate binding sites of the CBM29 protein (PDB: 1GWL) are too long and flat to be detected by ConCavity in the presence of a concave pocket between the chains. As illustrated here, ConCavity's inaccurate predictions are often the result of misleading evolutionary sequence conservation information (A) or ligands that bind partially or entirely outside of well-defined concave surface pockets (B, C). In (A) and (B), ConCavity misses the ligands, but identifies functionally relevant binding sites for other types of interactions (DNA and protein).
Figure 8
Figure 8. ConCavity prediction pipeline.
The large gray shape represents a protein 3D structure; the triangles represent surface residues; and the gray gradient symbolizes the varying sequence conservation values in the protein. Darker shades of each color indicate higher values. (A) The initial grid values come from the combination of evolutionary sequence conservation information and a structural predictor, in this example Ligsite. The algorithm proceeds similarly for PocketFinder and Surfnet. (B) The grid generated in (A) is thresholded based on morphological criteria so that only well-formed pockets have non-zero values. For simplicity, only grid values near the pockets are shown. (C) Finally, the grid representing the pocket predictions is mapped to the surface of the protein. We perform a 3D Gaussian blur (formula image
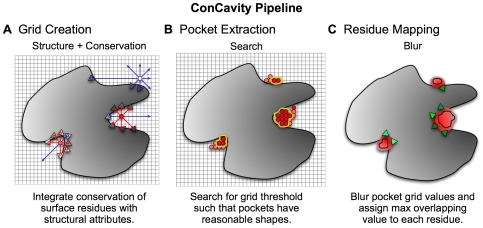
) of the pockets, and assign each residue the highest overlapping grid value. Residues near regions of space with very high grid values receive the highest scores.

Similar articles

Cited by

References

    1. Huang B, Schroeder M. LIGSITEcsc: predicting ligand binding sites using the Connolly surface and degree of conservation. BMC Struct Bio. 2006;6:19. - PMC - PubMed
    1. Capra J, Singh M. Predicting functionally important residues from sequence conservation. Bioinf. 2007;23:1875–1882. - PubMed
    1. Lopez G, Valencia A, Tress M. firestar---prediction of functionally important residues using structural templates and alignment reliability. Nucleic Acids Res. 2007;35:W573–W577. - PMC - PubMed
    1. Kuznetsov I, Gou Z, Li R, Hwang S. Using evolutionary and structural information to predict DNA-binding sites on DNA-binding proteins. Proteins: Stuct, Func, and Bioinf. 2006;64:19–27. - PubMed
    1. Youn E, Peters B, Radivojac P, Mooney S. Evaluation of features for catalytic residue prediction in novel folds. Prot Sci. 2007;16:216–226. - PMC - PubMed

Publication types