

Identification of MAMDC1 as a candidate susceptibility gene for systemic lupus erythematosus (SLE)
- PMID: 19997561
- PMCID: PMC2785483
- DOI: 10.1371/journal.pone.0008037
Identification of MAMDC1 as a candidate susceptibility gene for systemic lupus erythematosus (SLE)
Abstract
Background: Systemic lupus erythematosus (SLE) is a complex autoimmune disorder with multiple susceptibility genes. We have previously reported suggestive linkage to the chromosomal region 14q21-q23 in Finnish SLE families.
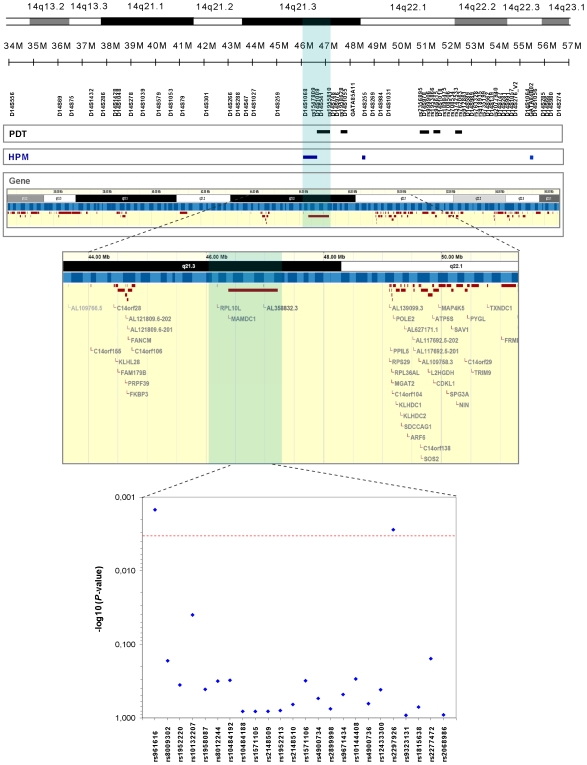
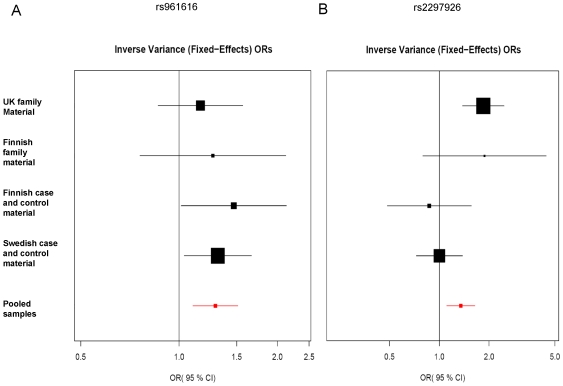
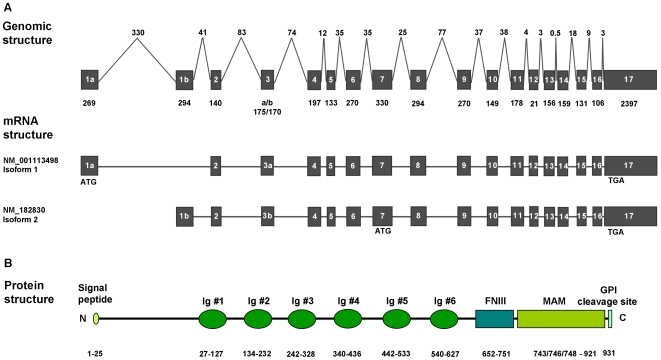
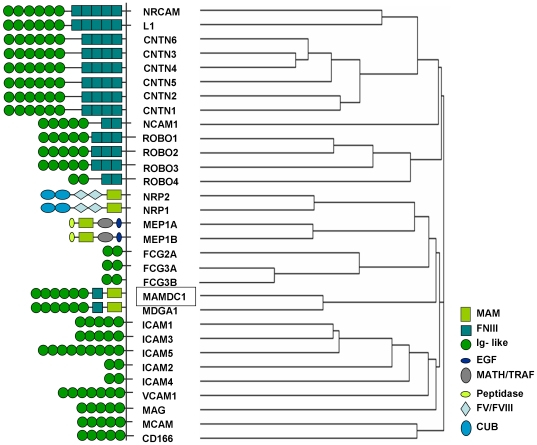
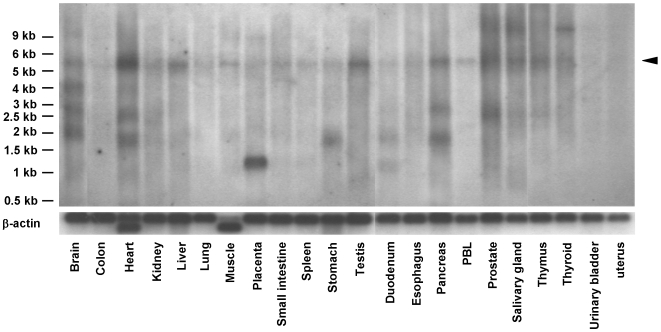
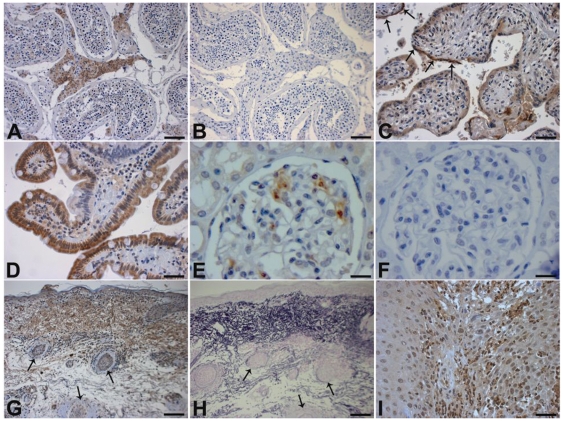
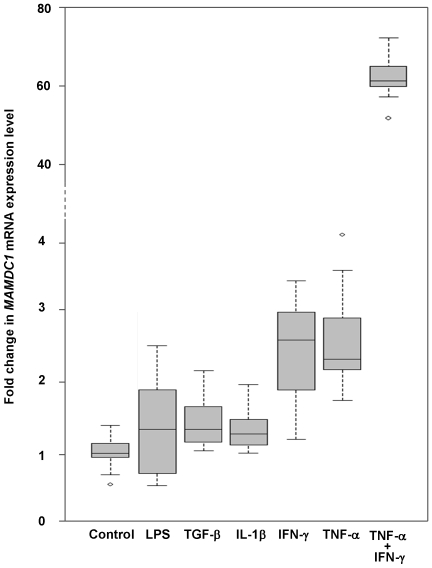
Principal findings: Genetic fine mapping of this region in the same family material, together with a large collection of parent affected trios from UK and two independent case-control cohorts from Finland and Sweden, indicated that a novel uncharacterized gene, MAMDC1 (MAM domain containing glycosylphosphatidylinositol anchor 2, also known as MDGA2, MIM 611128), represents a putative susceptibility gene for SLE. In a combined analysis of the whole dataset, significant evidence of association was detected for the MAMDC1 intronic single nucleotide polymorphisms (SNP) rs961616 (P -value = 0.001, Odds Ratio (OR) = 1.292, 95% CI 1.103-1.513) and rs2297926 (P -value = 0.003, OR = 1.349, 95% CI 1.109-1.640). By Northern blot, real-time PCR (qRT-PCR) and immunohistochemical (IHC) analyses, we show that MAMDC1 is expressed in several tissues and cell types, and that the corresponding mRNA is up-regulated by the pro-inflammatory cytokines tumour necrosis factor alpha (TNF-alpha) and interferon gamma (IFN-gamma) in THP-1 monocytes. Based on its homology to known proteins with similar structure, MAMDC1 appears to be a novel member of the adhesion molecules of the immunoglobulin superfamily (IgCAM), which is involved in cell adhesion, migration, and recruitment to inflammatory sites. Remarkably, some IgCAMs have been shown to interact with ITGAM, the product of another SLE susceptibility gene recently discovered in two independent genome wide association (GWA) scans.
Significance: Further studies focused on MAMDC1 and other molecules involved in these pathways might thus provide new insight into the pathogenesis of SLE.
Conflict of interest statement
Figures
Similar articles
-
Single-nucleotide polymorphisms of MAMDC1 are associated with rash and photosensitivity, but not disease risk, of systemic lupus erythematosus in Chinese mainland population.Clin Rheumatol. 2011 Oct;30(10):1373-8. doi: 10.1007/s10067-011-1794-2. Epub 2011 Jun 10. Clin Rheumatol. 2011. PMID: 21660437
-
Polymorphisms of the ITGAM gene confer higher risk of discoid cutaneous than of systemic lupus erythematosus.PLoS One. 2010 Dec 2;5(12):e14212. doi: 10.1371/journal.pone.0014212. PLoS One. 2010. PMID: 21151989 Free PMC article.
-
Current advances in the human lupus genetics.Curr Rheumatol Rep. 2004 Oct;6(5):391-8. doi: 10.1007/s11926-004-0014-3. Curr Rheumatol Rep. 2004. PMID: 15355752 Review.
-
Update on human systemic lupus erythematosus genetics.Curr Opin Rheumatol. 2004 Sep;16(5):513-21. doi: 10.1097/01.bor.0000132648.62680.81. Curr Opin Rheumatol. 2004. PMID: 15314487 Review.
-
Haplotype associations define target regions for susceptibility loci in systemic lupus erythematosus.Eur J Hum Genet. 2004 Jun;12(6):489-94. doi: 10.1038/sj.ejhg.5201125. Eur J Hum Genet. 2004. PMID: 15054392
Cited by
-
Significance of glycosylphosphatidylinositol-anchored protein enrichment in lipid rafts for the control of autoimmunity.J Biol Chem. 2013 Aug 30;288(35):25490-25499. doi: 10.1074/jbc.M113.492611. Epub 2013 Jul 17. J Biol Chem. 2013. PMID: 23864655 Free PMC article.
-
Private rare deletions in SEC16A and MAMDC4 may represent novel pathogenic variants in familial axial spondyloarthritis.Ann Rheum Dis. 2016 Apr;75(4):772-9. doi: 10.1136/annrheumdis-2014-206484. Epub 2015 May 8. Ann Rheum Dis. 2016. PMID: 25956157 Free PMC article.
-
Single-nucleotide polymorphisms of MAMDC1 are associated with rash and photosensitivity, but not disease risk, of systemic lupus erythematosus in Chinese mainland population.Clin Rheumatol. 2011 Oct;30(10):1373-8. doi: 10.1007/s10067-011-1794-2. Epub 2011 Jun 10. Clin Rheumatol. 2011. PMID: 21660437
-
Sporadic Parkinson's Disease Potential Risk Loci Identified in Han Ancestry of Chinese Mainland.Front Aging Neurosci. 2021 Jan 12;12:603793. doi: 10.3389/fnagi.2020.603793. eCollection 2020. Front Aging Neurosci. 2021. PMID: 33510632 Free PMC article.
References
-
- Danchenko N, Satia JA, Anthony MS. Epidemiology of systemic lupus erythematosus: a comparison of worldwide disease burden. Lupus. 2006;15:308–318. - PubMed
-
- Deapen D, Escalante A, Weinrib L, Horwitz D, Bachman B, et al. A revised estimate of twin concordance in systemic lupus erythematosus. Arthritis Rheum. 1992;35:311–318. - PubMed
-
- Molina V, Shoenfeld Y. Infection, vaccines and other environmental triggers of autoimmunity. Autoimmunity. 2005;38:235–245. - PubMed
-
- Hochberg MC. The application of genetic epidemiology to systemic lupus erythematosus. J Rheumatol. 1987;14:867–869. - PubMed
-
- Tsao BP. Update on human systemic lupus erythematosus genetics. Curr Opin Rheumatol. 2004;16:513–521. - PubMed
Publication types
MeSH terms
Substances
Grants and funding
LinkOut - more resources
Full Text Sources
Other Literature Sources
Medical
Molecular Biology Databases
Research Materials
