

Accurate and reliable cancer classification based on probabilistic inference of pathway activity
- PMID: 19997592
- PMCID: PMC2781165
- DOI: 10.1371/journal.pone.0008161
Accurate and reliable cancer classification based on probabilistic inference of pathway activity
Abstract
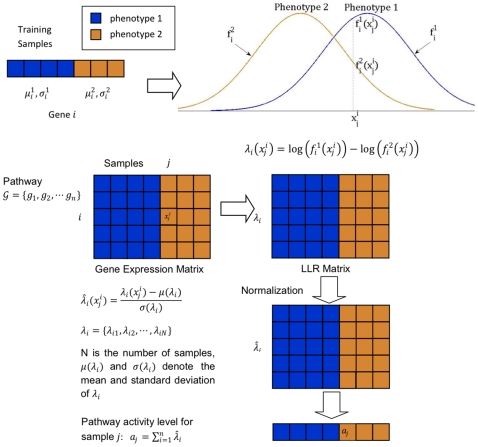
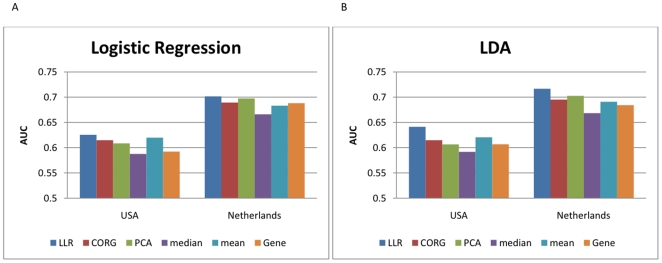
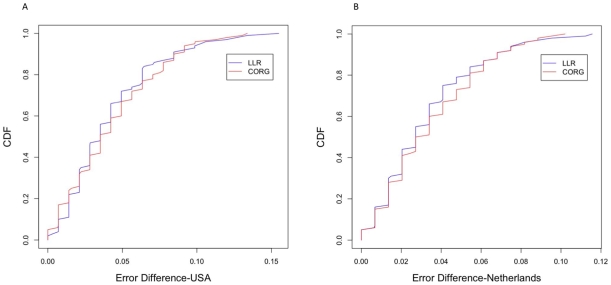
With the advent of high-throughput technologies for measuring genome-wide expression profiles, a large number of methods have been proposed for discovering diagnostic markers that can accurately discriminate between different classes of a disease. However, factors such as the small sample size of typical clinical data, the inherent noise in high-throughput measurements, and the heterogeneity across different samples, often make it difficult to find reliable gene markers. To overcome this problem, several studies have proposed the use of pathway-based markers, instead of individual gene markers, for building the classifier. Given a set of known pathways, these methods estimate the activity level of each pathway by summarizing the expression values of its member genes, and use the pathway activities for classification. It has been shown that pathway-based classifiers typically yield more reliable results compared to traditional gene-based classifiers. In this paper, we propose a new classification method based on probabilistic inference of pathway activities. For a given sample, we compute the log-likelihood ratio between different disease phenotypes based on the expression level of each gene. The activity of a given pathway is then inferred by combining the log-likelihood ratios of the constituent genes. We apply the proposed method to the classification of breast cancer metastasis, and show that it achieves higher accuracy and identifies more reproducible pathway markers compared to several existing pathway activity inference methods.
Conflict of interest statement
Figures
 -score of the top
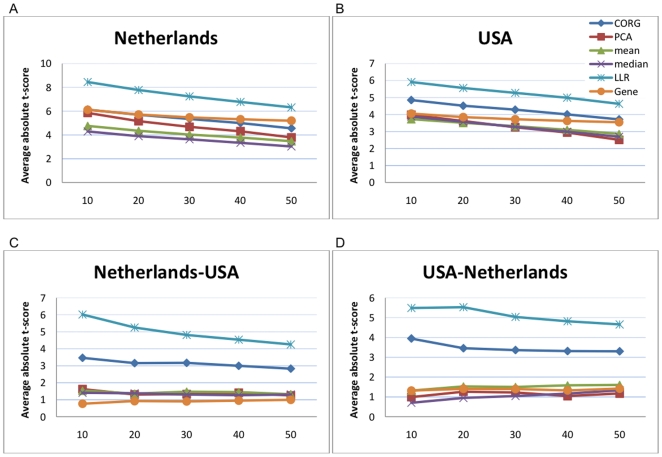
  markers for the Netherlands breast cancer dataset. Pathway activities have been inferred using five different methods: CORG, PCA, mean, median, and LLR (proposed method). The discriminative power of the top gene markers was estimated for comparison (labeled as “Gene”). (B) Mean absolute
  -score of the top markers for the USA breast cancer dataset. (C) The markers were ranked based on the Netherlands dataset and the mean absolute
  -score of the top
  markers was computed based on the USA dataset. (D) The markers were ranked based on the USA dataset and the mean absolute
  -score of the top markers was computed based on the Netherlands dataset.
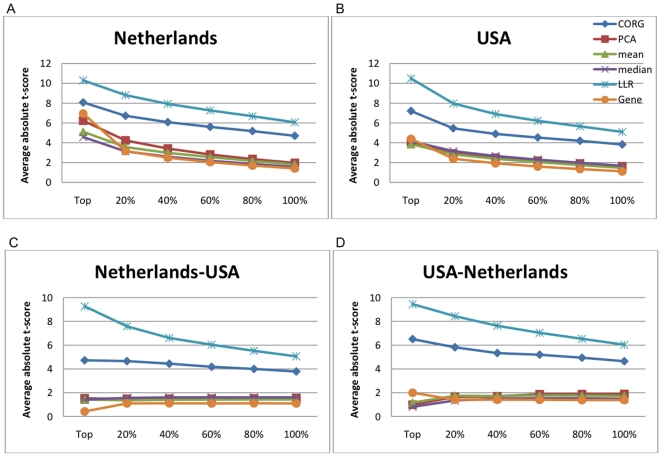
 -score of the top
  markers for the Netherlands dataset. (B) Mean absolute
  -score of the top markers for the USA dataset. (C) The markers were ranked based on the Netherlands dataset and the mean absolute
  -score of the top
  markers was computed based on the USA dataset. (D) The markers were ranked based on the USA dataset and the mean score of the top
  markers was computed based on the Netherlands dataset.
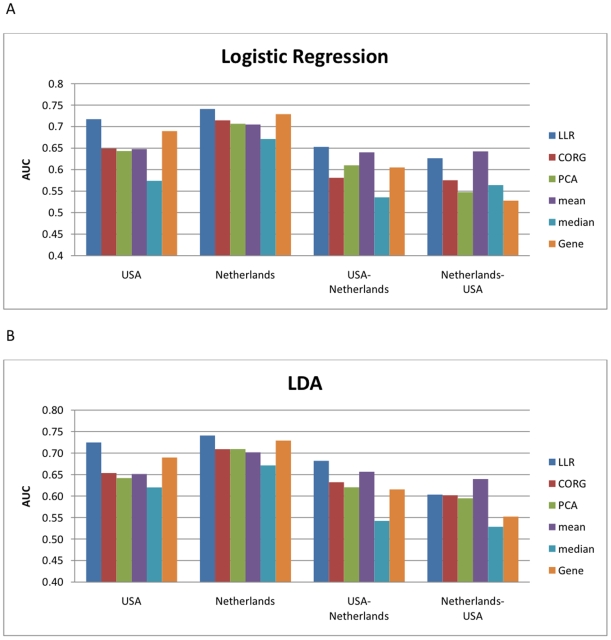
Similar articles
-
Mixture classification model based on clinical markers for breast cancer prognosis.Artif Intell Med. 2010 Feb-Mar;48(2-3):129-37. doi: 10.1016/j.artmed.2009.07.008. Epub 2009 Dec 14. Artif Intell Med. 2010. PMID: 20005686
-
Identification of diagnostic subnetwork markers for cancer in human protein-protein interaction network.BMC Bioinformatics. 2010 Oct 7;11 Suppl 6(Suppl 6):S8. doi: 10.1186/1471-2105-11-S6-S8. BMC Bioinformatics. 2010. PMID: 20946619 Free PMC article.
-
Identification of Robust Pathway Markers for Cancer through Rank-Based Pathway Activity Inference.Adv Bioinformatics. 2013;2013:618461. doi: 10.1155/2013/618461. Epub 2013 Feb 27. Adv Bioinformatics. 2013. PMID: 23533400 Free PMC article.
-
Inferring pathway activity toward precise disease classification.PLoS Comput Biol. 2008 Nov;4(11):e1000217. doi: 10.1371/journal.pcbi.1000217. Epub 2008 Nov 7. PLoS Comput Biol. 2008. PMID: 18989396 Free PMC article.
-
Pathway activity inference for multiclass disease classification through a mathematical programming optimisation framework.BMC Bioinformatics. 2014 Dec 5;15(1):390. doi: 10.1186/s12859-014-0390-2. BMC Bioinformatics. 2014. PMID: 25475756 Free PMC article.
Cited by
-
The cure: design and evaluation of a crowdsourcing game for gene selection for breast cancer survival prediction.JMIR Serious Games. 2014 Jul 29;2(2):e7. doi: 10.2196/games.3350. JMIR Serious Games. 2014. PMID: 25654473 Free PMC article.
-
Robustness evaluations of pathway activity inference methods on gene expression data.BMC Bioinformatics. 2024 Jan 12;25(1):23. doi: 10.1186/s12859-024-05632-w. BMC Bioinformatics. 2024. PMID: 38216898 Free PMC article.
-
Clustering gene expression regulators: new approach to disease subtyping.PLoS One. 2014 Jan 9;9(1):e84955. doi: 10.1371/journal.pone.0084955. eCollection 2014. PLoS One. 2014. PMID: 24416320 Free PMC article.
-
Bayesian Gene Selection Based on Pathway Information and Network-Constrained Regularization.Comput Math Methods Med. 2021 Aug 4;2021:7471516. doi: 10.1155/2021/7471516. eCollection 2021. Comput Math Methods Med. 2021. PMID: 34394707 Free PMC article.
-
Pathway-based analyses of gene expression profiles at low doses of ionizing radiation.Front Bioinform. 2024 May 14;4:1280971. doi: 10.3389/fbinf.2024.1280971. eCollection 2024. Front Bioinform. 2024. PMID: 38812660 Free PMC article.
References
-
- Alizadeh AA, Eisen MB, Davis RE, Ma C, Lossos IS, et al. Distinct types of diffuse large B-cell lymphoma identified by gene expression profiling. Nature. 2000;403:503–511. - PubMed
-
- Golub TR, Slonim DK, Tamayo P, Huard C, Gaasenbeek M, et al. Molecular classification of cancer: class discovery and class prediction by gene expression monitoring. Science. 1999;286:531–537. - PubMed
-
- Perez-Diez A, Morgun A, Shulzhenko N. Microarrays for cancer diagnosis and classification. Adv Exp Med Biol. 2007;593:74–85. - PubMed
-
- Ramaswamy S, Ross KN, Lander ES, Golub TR. A molecular signature of metastasis in primary solid tumors. Nat Genet. 2003;33:49–54. - PubMed
-
- Efron B, Tibshirani R. Empirical bayes methods and false discovery rates for microarrays. Genet Epidemiol. 2002;23:70–86. - PubMed
Publication types
MeSH terms
Substances
LinkOut - more resources
Full Text Sources
Other Literature Sources
