

Orientation of mitotic spindles during the 8- to 16-cell stage transition in mouse embryos
- PMID: 19997595
- PMCID: PMC2781390
- DOI: 10.1371/journal.pone.0008171
Orientation of mitotic spindles during the 8- to 16-cell stage transition in mouse embryos
Abstract
Background: Asymmetric cell divisions are involved in the divergence of the first two lineages of the pre-implantation mouse embryo. They first take place after cell polarization (during compaction) at the 8-cell stage. It is thought that, in contrast to many species, spindle orientation is random, although there is no direct evidence for this.
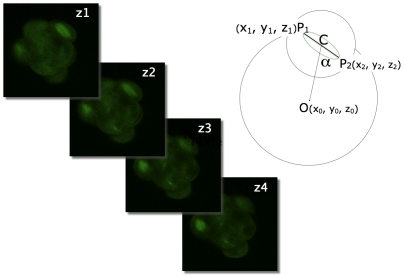
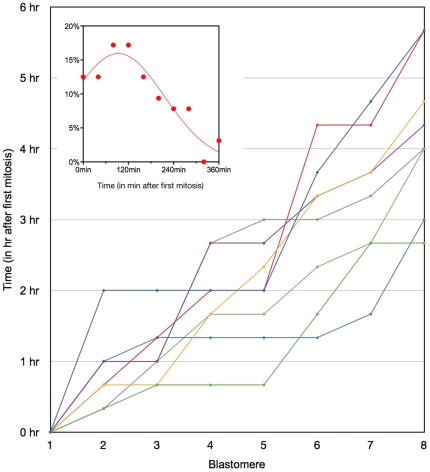
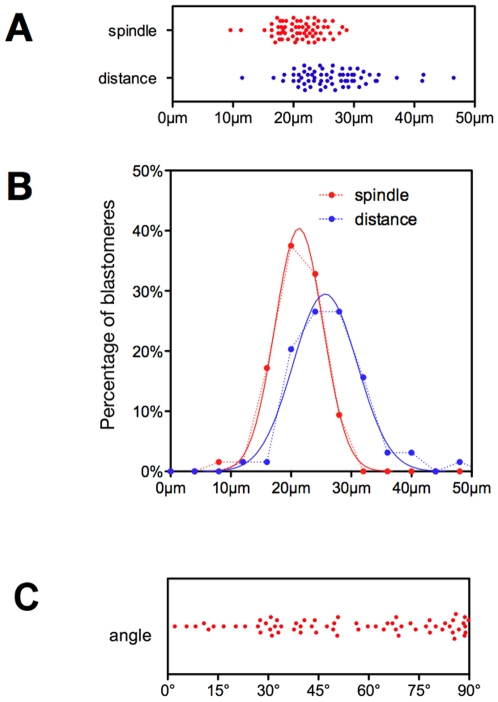
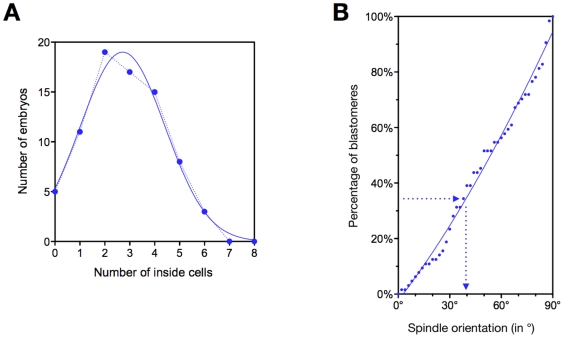
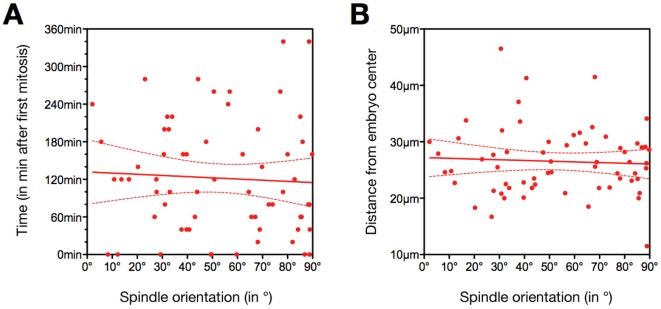
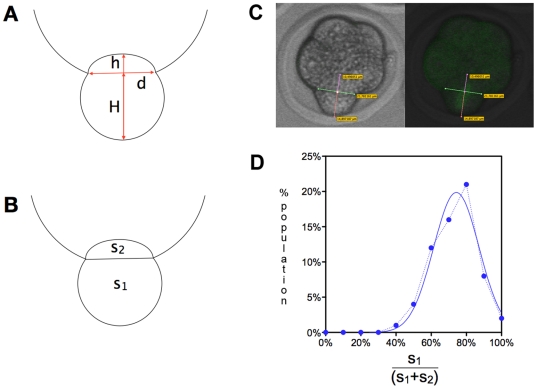
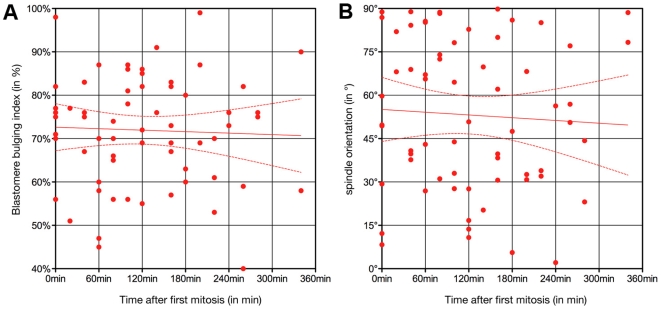
Methodology/principal findings: Tubulin-GFP and live imaging with a spinning disk confocal microscope were used to directly study spindle orientation in whole embryos undergoing the 8- to 16-cell stage transition. This approach allowed us to determine that there is no predetermined cleavage pattern in 8-cell compacted mouse embryos and that mitotic spindle orientation in live embryo is only modulated by the extent of cell rounding up during mitosis.
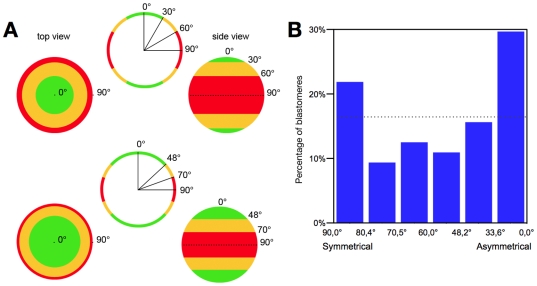
Conclusions: These results clearly demonstrate that spindle orientation is not controlled at the 8- to 16-cell transition, but influenced by cell bulging during mitosis, thus reinforcing the idea that pre-implantation development is highly regulative and not pre-patterned.
Conflict of interest statement
Figures


Similar articles
-
Cell-cell association directed mitotic spindle orientation in the early development of the marine shrimp Sicyonia ingentis.Development. 1997 Feb;124(4):773-80. doi: 10.1242/dev.124.4.773. Development. 1997. PMID: 9043059
-
4D imaging reveals a shift in chromosome segregation dynamics during mouse pre-implantation development.Cell Cycle. 2013 Jan 1;12(1):157-65. doi: 10.4161/cc.23052. Epub 2012 Dec 19. Cell Cycle. 2013. PMID: 23255117 Free PMC article.
-
Shape of the first mitotic spindles impacts multinucleation in human embryos.Nat Commun. 2024 Jun 25;15(1):5381. doi: 10.1038/s41467-024-49815-8. Nat Commun. 2024. PMID: 38918406 Free PMC article.
-
Regulation of the cell cycle in early mammalian embryos and its clinical implications.Int J Dev Biol. 2019;63(3-4-5):113-122. doi: 10.1387/ijdb.180400ma. Int J Dev Biol. 2019. PMID: 30785212 Review.
-
Wnt-dependent spindle polarization in the early C. elegans embryo.Semin Cell Dev Biol. 2006 Apr;17(2):204-13. doi: 10.1016/j.semcdb.2006.04.005. Epub 2006 May 2. Semin Cell Dev Biol. 2006. PMID: 16765610 Review.
Cited by
-
A self-organization framework for symmetry breaking in the mammalian embryo.Nat Rev Mol Cell Biol. 2013 Jul;14(7):452-9. doi: 10.1038/nrm3602. Epub 2013 Jun 19. Nat Rev Mol Cell Biol. 2013. PMID: 23778971 Review.
-
Spatial positioning of preimplantation mouse embryo cells is regulated by mTORC1 and m7G-cap-dependent translation at the 8- to 16-cell transition.Open Biol. 2023 Aug;13(8):230081. doi: 10.1098/rsob.230081. Epub 2023 Aug 9. Open Biol. 2023. PMID: 37553074 Free PMC article.
-
Mitotic cells contract actomyosin cortex and generate pressure to round against or escape epithelial confinement.Nat Commun. 2015 Nov 25;6:8872. doi: 10.1038/ncomms9872. Nat Commun. 2015. PMID: 26602832 Free PMC article.
-
Generative model for the first cell fate bifurcation in mammalian development.Development. 2025 Aug 5:dev.204717. doi: 10.1242/dev.204717. Online ahead of print. Development. 2025. PMID: 40762476 Free PMC article.
-
A tale of two cell-fates: role of the Hippo signaling pathway and transcription factors in early lineage formation in mouse preimplantation embryos.Mol Hum Reprod. 2020 Sep 1;26(9):653-664. doi: 10.1093/molehr/gaaa052. Mol Hum Reprod. 2020. PMID: 32647873 Free PMC article. Review.
References
-
- Gönczy P. Mechanisms of asymmetric cell division: floes and worms pave the way. Nature Cell Biology. 2008;9:355–66. - PubMed
-
- Patalano S, Prulière G, Prodon F, Paix A, Dru P, et al. The aPKC-PAR-6-PAR-3 cell polarity complex localizes to the centrosome attracting body, a macroscopic cortical structure responsible for asymmetric divisions in the early ascidian embryo. Journal of Cell Sciences. 2006;119:1592–1603. - PubMed
-
- Gueth-Hallonet C, Antony C, Aghion J, Santa-Maria A, Lajoie-Mazenc I, et al. Gamma-Tubulin is present in acentriolar MTOCs during early mouse development. Journal of Cell Sciences. 1991;105:157–166. - PubMed
-
- Kelly SJ, Mulnard JG, Graham CF. Cell division and cell allocation in early mouse development. Journal of Embryology and experimental Morphology. 1978;48:37–51. - PubMed
-
- Spindle AI. Cell allocation in preimplantation mouse chimeras. Journal of Experimental Zoology. 1982;235:361–367. - PubMed
Publication types
MeSH terms
LinkOut - more resources
Full Text Sources
