

Striated muscle regulation of isometric tension by multiple equilibria
- PMID: 19997610
- PMCID: PMC2784068
- DOI: 10.1371/journal.pone.0008052
Striated muscle regulation of isometric tension by multiple equilibria
Abstract
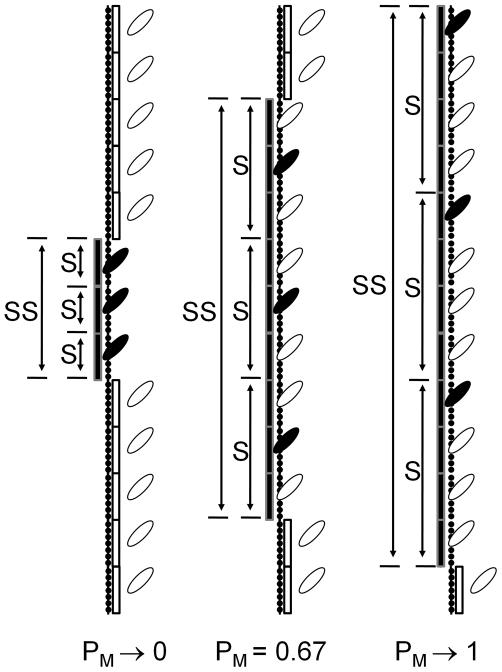
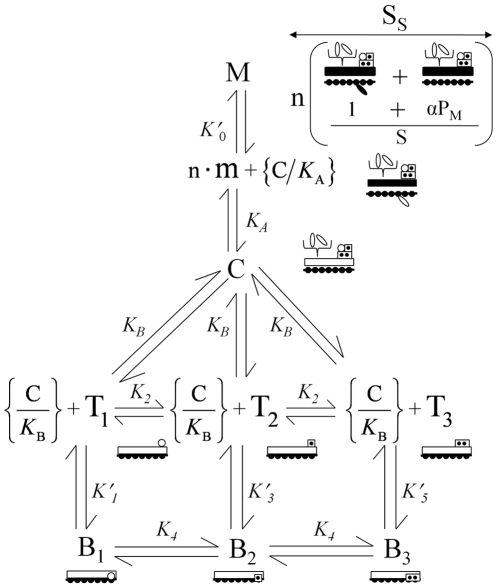
Cooperative activation of striated muscle by calcium is based on the movement of tropomyosin described by the steric blocking theory of muscle contraction. Presently, the Hill model stands alone in reproducing both myosin binding data and a sigmoidal-shaped curve characteristic of calcium activation (Hill TL (1983) Two elementary models for the regulation of skeletal muscle contraction by calcium. Biophys J 44: 383-396.). However, the free myosin is assumed to be fixed by the muscle lattice and the cooperative mechanism is based on calcium-dependent interactions between nearest neighbor tropomyosin subunits, which has yet to be validated. As a result, no comprehensive model has been shown capable of fitting actual tension data from striated muscle. We show how variable free myosin is a selective advantage for activating the muscle and describe a mechanism by which a conformational change in tropomyosin propagates free myosin given constant total myosin. This mechanism requires actin, tropomyosin, and filamentous myosin but is independent of troponin. Hence, it will work equally well with striated, smooth and non-muscle contractile systems. Results of simulations with and without data are consistent with a strand of tropomyosin composed of approximately 20 subunits being moved by the concerted action of 3-5 myosin heads, which compares favorably with the predicted length of tropomyosin in the overlap region of thick and thin filaments. We demonstrate that our model fits both equilibrium myosin binding data and steady-state calcium-dependent tension data and show how both the steepness of the response and the sensitivity to calcium can be regulated by the actin-troponin interaction. The model simulates non-cooperative calcium binding both in the presence and absence of strong binding myosin as has been observed. Thus, a comprehensive model based on three well-described interactions with actin, namely, actin-troponin, actin-tropomyosin, and actin-myosin can explain the cooperative calcium activation of striated muscle.
Conflict of interest statement
Figures
 (Curve A);
  (Curve B);
  (Curve C);
  (Curve D);
  (Curve E).
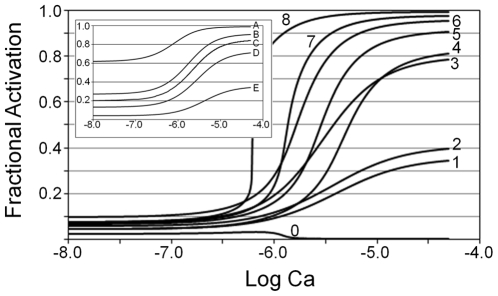
  and Curves 5, 7, and 8 compare the effects of varying n given fixed α and
  . For constant n and α (Curves 4–6), increasing
  shifts the curves toward greater calcium sensitivity while the steepness remains nearly the same. Curve 0 shows the mole fraction of Tm in Position C as a function of calcium.
  ,
,  (Curve 1);
  ,
,  ,
,  ,
,  (Curve 2);
  ,
,  ,
,  ,
,  (Curve 3);
  ,
,  ,
,  ,
,  (Curve 4);
  ,
,  ,
,  ,
,  (Curve 5);
  ,
,  ,
,  ,
,  (Curve 6);
  ,
,  ,
,  ,
,  (Curve 7);
  ,
,  ,
,  ,
,  (Curve 8).
  ,
,  .
.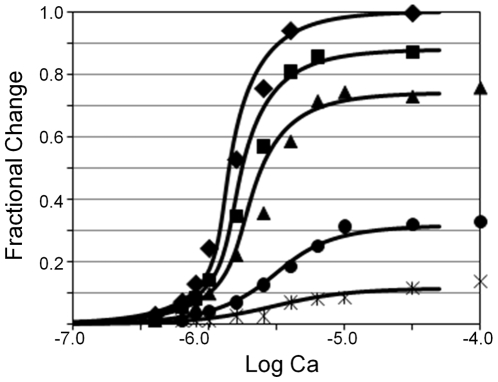
 ), 83% (
 ), 70% (
 ), 33% (
 ), 15% (
 ).
).  ,
,  ,
,  ,
,  ,
,  ,
,  .
.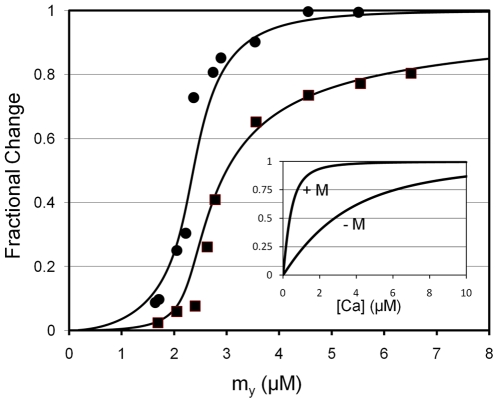
 and
and  ; the curve through the data is generated by Eq. 23 using
  . Total myosin binding data (squares) are fit with a curve representing the sum of coupled and free myosin binding using Eq. 25. As inputs to Eq. 25, coupled myosin binding is given by the change in fluorescence generated by Eq. 23 (
 ) and the free myosin binding is generated by simple mass action (
 ; Eq. 26).
  , respectively. Fixed inset parameters:
  ,
,  ,
,  ,
,  ,
,  .
.Similar articles
-
A comparison of muscle thin filament models obtained from electron microscopy reconstructions and low-angle X-ray fibre diagrams from non-overlap muscle.J Struct Biol. 2006 Aug;155(2):273-84. doi: 10.1016/j.jsb.2006.02.020. Epub 2006 May 7. J Struct Biol. 2006. PMID: 16793285
-
Cooperative regulation of myosin-actin interactions by a continuous flexible chain II: actin-tropomyosin-troponin and regulation by calcium.Biophys J. 2003 May;84(5):3168-80. doi: 10.1016/S0006-3495(03)70041-1. Biophys J. 2003. PMID: 12719246 Free PMC article.
-
Cooperative regulation of myosin-S1 binding to actin filaments by a continuous flexible Tm-Tn chain.Eur Biophys J. 2012 Dec;41(12):1015-32. doi: 10.1007/s00249-012-0859-8. Epub 2012 Oct 7. Eur Biophys J. 2012. PMID: 23052974 Free PMC article.
-
Mechanism of the calcium-regulation of muscle contraction--in pursuit of its structural basis.Proc Jpn Acad Ser B Phys Biol Sci. 2015;91(7):321-50. doi: 10.2183/pjab.91.321. Proc Jpn Acad Ser B Phys Biol Sci. 2015. PMID: 26194856 Free PMC article. Review.
-
Regulation of contraction in striated muscle.Physiol Rev. 2000 Apr;80(2):853-924. doi: 10.1152/physrev.2000.80.2.853. Physiol Rev. 2000. PMID: 10747208 Review.
Cited by
-
Load sharing between synergistic muscles characterized by a ligand-binding approach and elastography.Sci Rep. 2023 Oct 25;13(1):18267. doi: 10.1038/s41598-023-45037-y. Sci Rep. 2023. PMID: 37880279 Free PMC article.
-
Enhanced troponin I binding explains the functional changes produced by the hypertrophic cardiomyopathy mutation A8V of cardiac troponin C.Arch Biochem Biophys. 2016 Jul 1;601:97-104. doi: 10.1016/j.abb.2016.03.011. Epub 2016 Mar 11. Arch Biochem Biophys. 2016. PMID: 26976709 Free PMC article.
-
Second-chance signal transduction explains cooperative flagellar switching.PLoS One. 2012;7(7):e41098. doi: 10.1371/journal.pone.0041098. Epub 2012 Jul 23. PLoS One. 2012. PMID: 22844429 Free PMC article.
-
Modeling Ca2+-Bound Troponin in Excitation Contraction Coupling.Front Physiol. 2016 Sep 21;7:406. doi: 10.3389/fphys.2016.00406. eCollection 2016. Front Physiol. 2016. PMID: 27708586 Free PMC article.
-
Mechanical contribution to muscle thin filament activation.J Biol Chem. 2020 Nov 20;295(47):15913-15922. doi: 10.1074/jbc.RA120.014438. Epub 2020 Sep 8. J Biol Chem. 2020. PMID: 32900850 Free PMC article.
References
Publication types
MeSH terms
Substances
LinkOut - more resources
Full Text Sources
Research Materials
