

The severity of pandemic H1N1 influenza in the United States, from April to July 2009: a Bayesian analysis
- PMID: 19997612
- PMCID: PMC2784967
- DOI: 10.1371/journal.pmed.1000207
The severity of pandemic H1N1 influenza in the United States, from April to July 2009: a Bayesian analysis
Abstract
Background: Accurate measures of the severity of pandemic (H1N1) 2009 influenza (pH1N1) are needed to assess the likely impact of an anticipated resurgence in the autumn in the Northern Hemisphere. Severity has been difficult to measure because jurisdictions with large numbers of deaths and other severe outcomes have had too many cases to assess the total number with confidence. Also, detection of severe cases may be more likely, resulting in overestimation of the severity of an average case. We sought to estimate the probabilities that symptomatic infection would lead to hospitalization, ICU admission, and death by combining data from multiple sources.
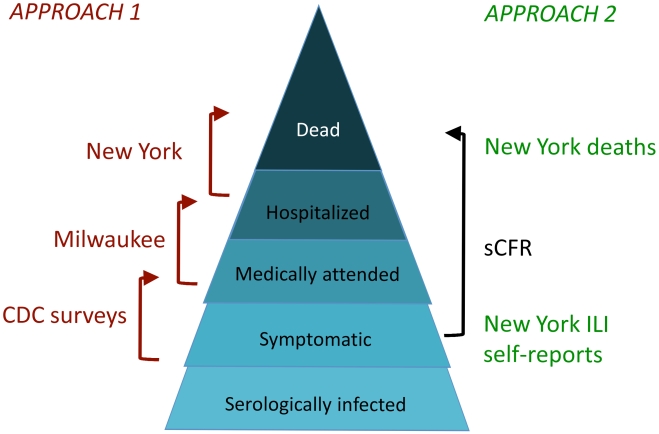
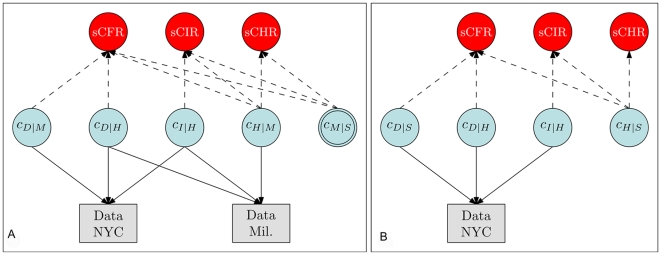
Methods and findings: We used complementary data from two US cities: Milwaukee attempted to identify cases of medically attended infection whether or not they required hospitalization, while New York City focused on the identification of hospitalizations, intensive care admission or mechanical ventilation (hereafter, ICU), and deaths. New York data were used to estimate numerators for ICU and death, and two sources of data--medically attended cases in Milwaukee or self-reported influenza-like illness (ILI) in New York--were used to estimate ratios of symptomatic cases to hospitalizations. Combining these data with estimates of the fraction detected for each level of severity, we estimated the proportion of symptomatic patients who died (symptomatic case-fatality ratio, sCFR), required ICU (sCIR), and required hospitalization (sCHR), overall and by age category. Evidence, prior information, and associated uncertainty were analyzed in a Bayesian evidence synthesis framework. Using medically attended cases and estimates of the proportion of symptomatic cases medically attended, we estimated an sCFR of 0.048% (95% credible interval [CI] 0.026%-0.096%), sCIR of 0.239% (0.134%-0.458%), and sCHR of 1.44% (0.83%-2.64%). Using self-reported ILI, we obtained estimates approximately 7-9 x lower. sCFR and sCIR appear to be highest in persons aged 18 y and older, and lowest in children aged 5-17 y. sCHR appears to be lowest in persons aged 5-17; our data were too sparse to allow us to determine the group in which it was the highest.
Conclusions: These estimates suggest that an autumn-winter pandemic wave of pH1N1 with comparable severity per case could lead to a number of deaths in the range from considerably below that associated with seasonal influenza to slightly higher, but with the greatest impact in children aged 0-4 and adults 18-64. These estimates of impact depend on assumptions about total incidence of infection and would be larger if incidence of symptomatic infection were higher or shifted toward adults, if viral virulence increased, or if suboptimal treatment resulted from stress on the health care system; numbers would decrease if the total proportion of the population symptomatically infected were lower than assumed.
Conflict of interest statement
ML has received consulting fees from the Avian/Pandemic Flu Registry (Outcome Sciences), sponsored in part by Roche.
Figures
Update of
-
The severity of pandemic H1N1 influenza in the United States, April - July 2009.PLoS Curr. 2009 Sep 25;1:RRN1042. doi: 10.1371/currents.RRN1042. PLoS Curr. 2009. PMID: 20029614 Free PMC article.
References
-
- Jordan WS, Jr, Denny FW, Jr, Badger GF, Curtiss C, Dingle JH, et al. A study of illness in a group of Cleveland families. XVII. The occurrence of Asian influenza. Am J Hyg. 1958;68:190–212. - PubMed
Publication types
MeSH terms
Grants and funding
LinkOut - more resources
Full Text Sources
Miscellaneous
