. 2009 Dec 3;4(12):e8141.
doi: 10.1371/journal.pone.0008141.

Reactive astrocytes in glial scar attract olfactory ensheathing cells migration by secreted TNF-alpha in spinal cord lesion of rat

Affiliations

Reactive astrocytes in glial scar attract olfactory ensheathing cells migration by secreted TNF-alpha in spinal cord lesion of rat

Zhida Su et al. PLoS One. .

Abstract

Background: After spinal cord injury (SCI), the formation of glial scar contributes to the failure of injured adult axons to regenerate past the lesion. Increasing evidence indicates that olfactory ensheathing cells (OECs) implanted into spinal cord are found to migrate into the lesion site and induce axons regeneration beyond glial scar and resumption of functions. However, little is known about the mechanisms of OECs migrating from injection site to glial scar/lesion site.

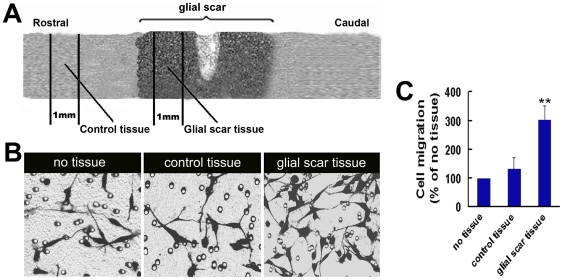
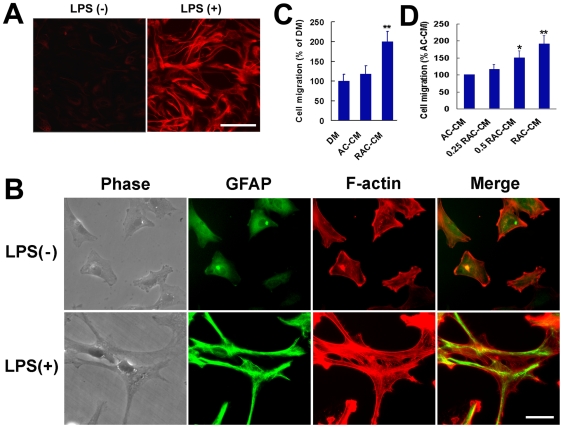
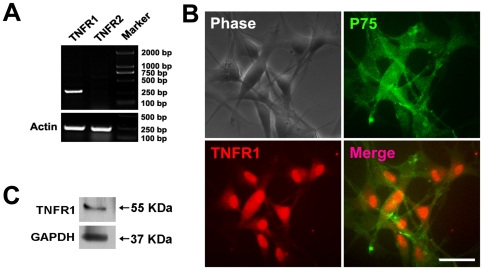
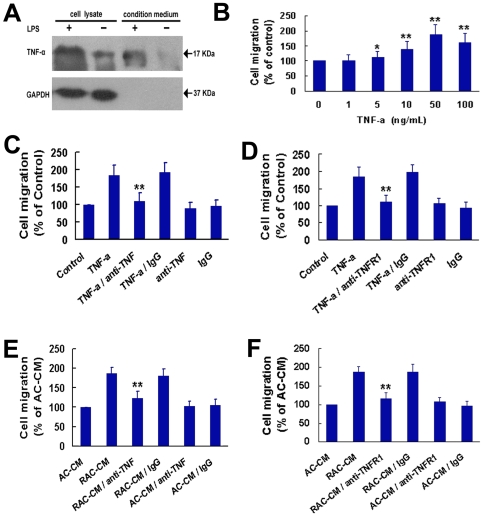
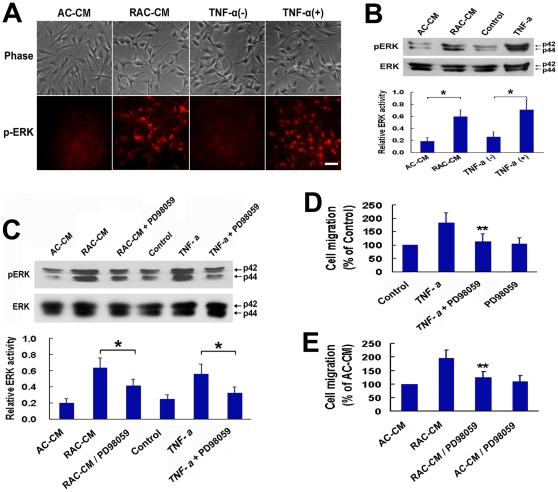
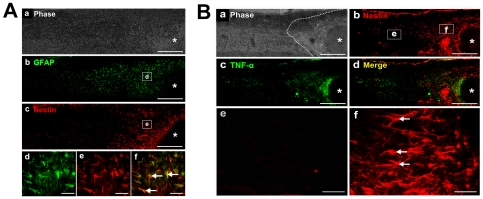
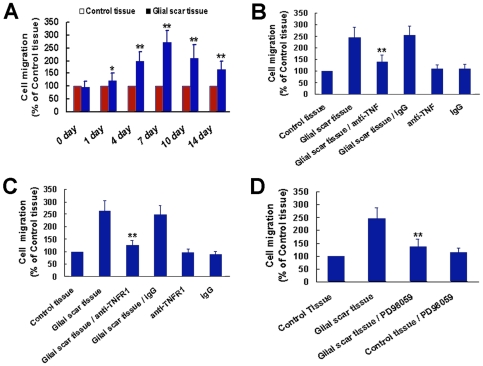
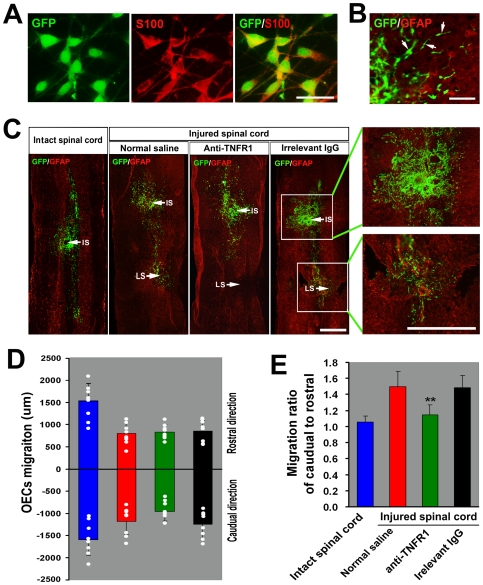
Methods and findings: In the present study, we identified a link between OECs migration and reactive astrocytes in glial scar that was mediated by the tumor necrosis factor-alpha (TNF-alpha). Initially, the Boyden chamber migration assay showed that both glial scar tissue and reactive astrocyte-conditioned medium promoted OECs migration in vitro. Reactive astrocyte-derived TNF-alpha and its type 1 receptor TNFR1 expressed on OECs were identified to be responsible for the promoting effect on OECs migration. TNF-alpha-induced OECs migration was demonstrated depending on activation of the extracellular signal-regulated kinase (ERK) signaling cascades. Furthermore, TNF-alpha secreted by reactive astrocytes in glial scar was also showed to attract OECs migration in a spinal cord hemisection injury model of rat.

Conclusions: These findings showed that TNF-alpha was released by reactive astrocytes in glial scar and attracted OECs migration by interacting with TNFR1 expressed on OECs via regulation of ERK signaling. This migration-attracting effect of reactive astrocytes on OECs may suggest a mechanism for guiding OECs migration into glial scar, which is crucial for OECs-mediated axons regrowth beyond the spinal cord lesion site.


Conflict of interest statement

Competing Interests: The authors have declared that no competing interests exist.

Figures

Figure 1
Figure 1. Analysis of the effect of glial scar tissue on OECs migration by a Boyden chamber migration assay.
(A) Schematic representation of the control tissue and glial scar tissue prepared from injured spinal cord. Seven days after SCI, the spinal cord spanning lesion site was dissected and placed in Hank's balanced salt solution. Glial scar tissue was prepared by cutting an approximately 1-mm-thick cross-section of spinal cord in the region of glial scar. Control tissue was prepared by cutting an approximately 1-mm-thick cross-section of spinal cord distal to the region of glial scar. The mobility of OECs was analyzed in a Boyden chamber migration assay. OECs were seeded onto the upper chamber at a density of 4×10⁵ cells, with the spinal cord explants (control tissue or glial scar) plated into the lower chamber, and incubated 8 hr at 37°C. (B) Photomicrograph of OECs transmigrated through the filter in the absence or presence of glial scar tissue. (C) Quantitative assessment of migrating cells under different conditions. **P<0.01 versus control tissue group.
Figure 2
Figure 2. Reactive astrocytes-conditioned medium promotes OECs migration.
(A, B) lipopolysaccharide (LPS) stimulates astrocytes to change into reactive astrocytes. After incubation with LPS (10 µg/mL) for 24 hr, astrocytes are activated to express nestin (A) and undergo an extensive hypertrophy of their cell bodies and cytoplasmic processes and a massive up-regulation of GFAP (B). Scale bars: 50 µm (A); 25 µm (B). (C) Reactive astrocyte-conditioned medium (RAC-CM) promotes OECs migration. After stimulation with defined medium (DM), astrocyte-conditioned medium (AC-CM) or RAC-CM for 8 hr, the migrating cells in the Boyden chambers are stained with Coomassie Brilliant Blue and counted. **P<0.01 versus DM. (D) Enhancement of migration of OECs by RAC-CM is dose-dependent. *P<0.05 versus AC-CM, **P<0.01 versus AC-CM.
Figure 3
Figure 3. TNFR1 is expressed on OECs.
(A) The mRNA of TNFR1 (301 bp) but not TNFR2 (264 bp) was identified in OECs by RT-PCR. (B) Cultured OECs were double-stained with antibodies against P75 and TNFR1 after treatment with Triton X-100. Scale bar = 50 µm. (C) Western blotting analysis for the expression of TNFR1 cell lysates of cultured OECs. GAPDH blotting severed as the loading control.
Figure 4
Figure 4. Reactive astrocytes secrete TNF-α to promote OECs migration by interacting with TNFR1.
(A) Reactive astrocytes produce TNF-α. The cell lysate and condition medium of OECs treated (+) or untreated (−) with LPS (10 µg/mL) at 37°C for 24 hr were subjected to immunoblotting with antibody against TNF-α (upper panel) and anti-GAPDH (lower panel). (B) Dose dependency of TNF-α effect on OECs migration. *P<0.05 versus control, **P<0.01 versus control. (C, D) The effect of TNF-α on the migration of OECs is mediated by TNFR1. Medium or OECs were pretreated with TNF-α antibody (5 µg/mL), TNFR1 antibody (2 µg/mL) or goat IgG for 2 hr and applied to Boyden chamber migration assays, stimulated with TNF-α (50 ng/mL). Cells without pretreatment but with TNF-α stimulation were defined as TNF-α group. Cells with neither pretreatment nor TNF-α stimulation were defined as control. **P<0.01 versus TNF-α group. (E, F) TNF-α in RAC-CM is involved in mediating the migration-promoting activity of OECs. RAC-CM or OECs were pretreated with TNF-α antibody (5 µg/mL), TNFR1 antibody (2 µg/mL) or goat IgG for 2 hr, then stimulated with RAC-CM. Cells without pretreatment but with RAC-CM stimulation were defined as RAC-CM group. Cells without pretreatment but with AC-CM stimulation were defined as AC-CM group. **P<0.01 versus RAC-CM group.
Figure 5
Figure 5. ERK activation is critical for mediating the effect of TNF-α on OECs migration.
(A, B) ERK activation in OECs was assessed with immunocytochemistry (A) and western blot (B) after incubation with RAC-CM or recombinant TNF-α. Densitometric analysis is shown in the bottom panel of (B) with the amount of p-ERK normalized to the amount of ERK. *P<0.05. Scale bar = 50 µm. (C) PD98059 treatment significantly inhibited the activation of ERK in OECs stimulated with RAC-CM or recombinant TNF-α. OECs were incubated with ERK-inhibitor PD98059 (30 µM) for 30 minutes before RAC-CM or TNF-a (50 ng/mL) was added. Densitometric analysis is shown in the bottom panel. *P<0.05. (D, E) In Boyden chamber migration assay, the migration induced by RAC-CM or recombinant TNF-α was evidently attenuated when OECs were pretreated with PD98059. **P<0.01 versus TNF-α or RAC-CM.
Figure 6
Figure 6. Astrocytes are activated to secrete TNF-α in hemisection SCI model.
(A)Ten days after SCI, immunohistochemical analysis was performed for the reactive astrocytes with anti-GFAP and anti-nestin. (d, e) Higher magnification of the outlined areas in b and c showed reactive astrocyte with an extensive hypertrophy of their cell bodies and cytoplasmic processes. (f) A merged picture of d and e. Scale bars: 500 µm (a–c); 50 µm (d–f). (B) TNF-α produced by reactive astrocytes was examined by double-stained with antibodies against nestin and TNF-α 10 days after SCI (a–d). (e, f) Higher magnification of the outlined areas in b. Scale bars: 500 µm (a–d); 50 µm (e, f). Asterisk indicates the lesion site. Dashed line in B indicates approximate border of the glial scar. Arrows indicate representative reactive astrocytes.
Figure 7
Figure 7. The effect of glial scar on OECs migration is mediated by secreted TNF-α.
(A) Glial scar promotes OECs migration in a manner of time-dependence. *P<0.05 or **P<0.01 versus control tissue. (B, C) The effect of glial scar on OECs migration is mediated by TNF-α and TNFR1. OECs were pretreated with TNF-α antibody (5 µg/mL), TNFR1 antibody (2 µg/mL) or goat IgG for 2 hours, and then incubated with glial scar tissue in a Boyden chamber. Cells without pretreatment but with glial scar tissue stimulation were defined as glial scar tissue group. Cells without pretreatment but with control tissue stimulation were defined as control tissue group. **P<0.01 versus glial scar tissue. (D) ERK activation is involved in glial scar-induced OECs migration. PD98059 treatment significantly attenuated the effect of glial scar tissue on OECs migration. **P<0.01 versus glial scar tissue group.
Figure 8
Figure 8. TNF-α attracts implanted OECs migration toward lesion site in vivo.
(A) S100 immunolabeling of GFP-expressing OECs in vitro. The majority of OECs cultured from GFP-transgenic rats express S100. (B) Higher power showing OECs at the edge of the injection site. Elongated profiles (arrows), suggestive of cell migration, as well as round and multipolar GFP labelled cells can be seen. (C) Horizontal sections from intact and contralateral hemisectioned spinal cords with GFP-expressing OECs injections 1.5 mm rostral to the lesion epicenter at the time of injury. The animals with SCI were treated with normal saline (N.S.), anti-TNFR1 antibody or irrelevant goat IgG every day through a pipe embedded in the subarachnoid space. Arrows indicate the injection site (IS) and lesion site (LS). (D) Quantitative assessment of cell migration at 10 days after transplantation into the spinal cord. Mean and standard deviation of the migration distances in rostral and caudal directions are presented for each group. The white dot indicates the migration distance for each injection. Blue bars, OECs into intact spinal cord; red bars, OECs into injured spinal cord and treated with normal saline; green bars, OECs into injured spinal cord and treated with anti-TNFR1; black bars, OECs into injured spinal cord and treated with irrelevant IgG. (E) Histogram showing the average migration ratio of the caudal to rostral direction. **P<0.01 versus normal saline or irrelevant IgG group. Scale bars: 50 µm (A), 100 µm (B), 500 µm (C).

References

    1. Cervos NJ, Lafuente JV. Traumatic brain injuries: structural changes. J Neurol Sci. 1991;103(Suppl):S3–14. - PubMed
    1. Silver J, Miller JH. Regeneration beyond the glial scar. Nat Rev Neurosci. 2004;5:146–156. - PubMed
    1. Yiu G, He ZG. Glial inhibition of CNS axon regeneration. Nature reviews. Neuroscience. 2006;7(8):617–627. - PMC - PubMed
    1. Davies SJ, Fitch MT, Memberg SP, Hall AK, Raisman G, et al. Regeneration of adult axons in white matter tracts of the central nervous system. Nature. 1997;390:680–683. - PubMed
    1. Jones LL, Margolis RU, Tuszynski MH. The chondroitin sulfate proteoglycans neurocan, brevican, phosphacan, and versican are differentially regulated following spinal cord injury. Exp Neurol. 2003;182:399–411. - PubMed

Publication types

MeSH terms

Substances