

Multi-organ expression profiling uncovers a gene module in coronary artery disease involving transendothelial migration of leukocytes and LIM domain binding 2: the Stockholm Atherosclerosis Gene Expression (STAGE) study
- PMID: 19997623
- PMCID: PMC2780352
- DOI: 10.1371/journal.pgen.1000754
Multi-organ expression profiling uncovers a gene module in coronary artery disease involving transendothelial migration of leukocytes and LIM domain binding 2: the Stockholm Atherosclerosis Gene Expression (STAGE) study
Abstract
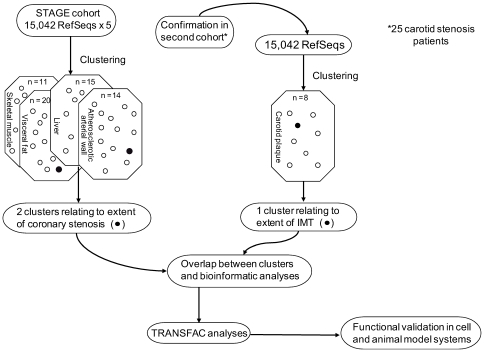
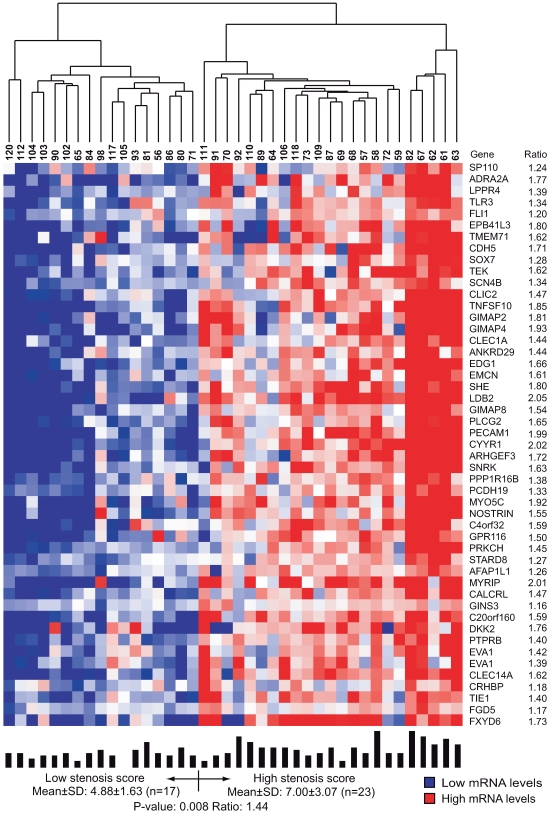
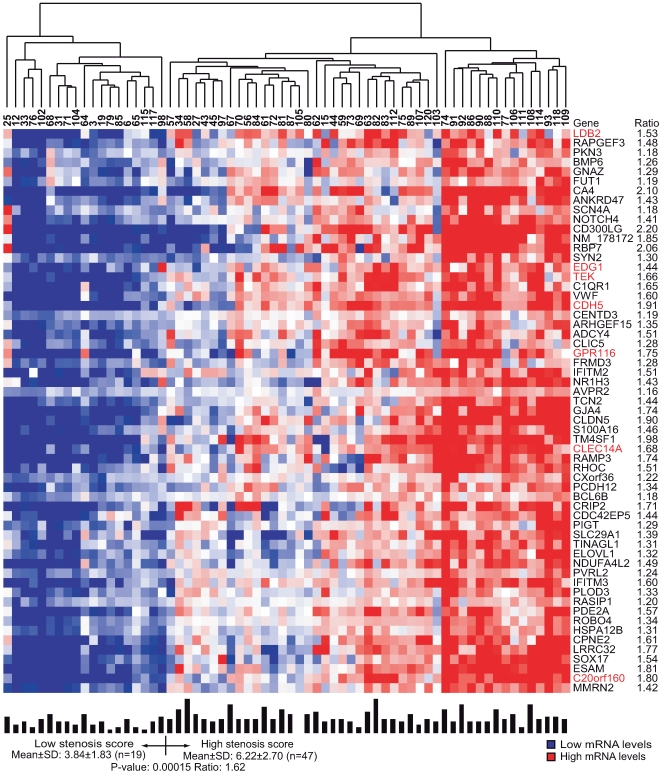
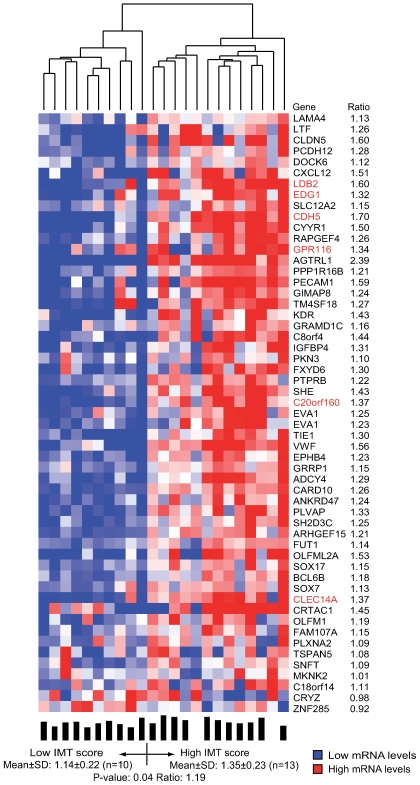
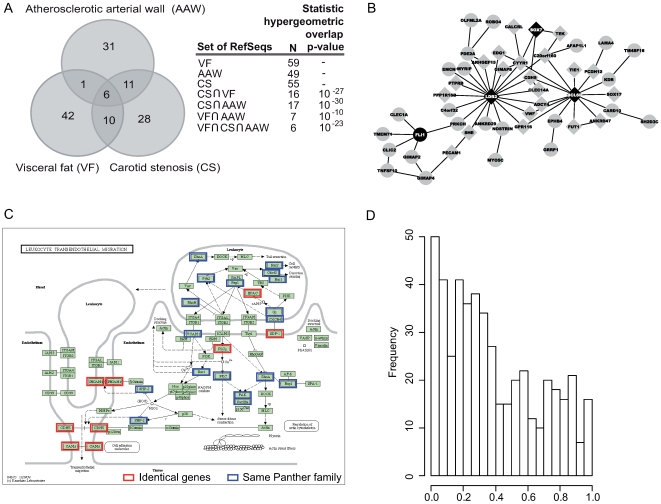
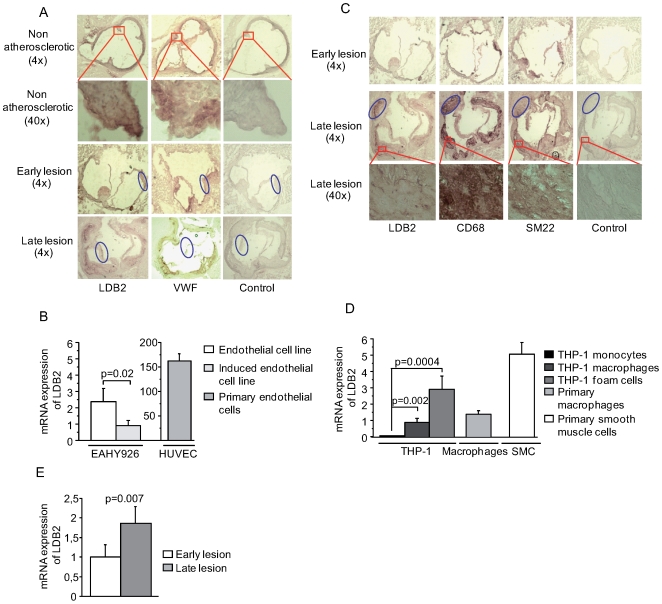
Environmental exposures filtered through the genetic make-up of each individual alter the transcriptional repertoire in organs central to metabolic homeostasis, thereby affecting arterial lipid accumulation, inflammation, and the development of coronary artery disease (CAD). The primary aim of the Stockholm Atherosclerosis Gene Expression (STAGE) study was to determine whether there are functionally associated genes (rather than individual genes) important for CAD development. To this end, two-way clustering was used on 278 transcriptional profiles of liver, skeletal muscle, and visceral fat (n = 66/tissue) and atherosclerotic and unaffected arterial wall (n = 40/tissue) isolated from CAD patients during coronary artery bypass surgery. The first step, across all mRNA signals (n = 15,042/12,621 RefSeqs/genes) in each tissue, resulted in a total of 60 tissue clusters (n = 3958 genes). In the second step (performed within tissue clusters), one atherosclerotic lesion (n = 49/48) and one visceral fat (n = 59) cluster segregated the patients into two groups that differed in the extent of coronary stenosis (P = 0.008 and P = 0.00015). The associations of these clusters with coronary atherosclerosis were validated by analyzing carotid atherosclerosis expression profiles. Remarkably, in one cluster (n = 55/54) relating to carotid stenosis (P = 0.04), 27 genes in the two clusters relating to coronary stenosis were confirmed (n = 16/17, P<10(-27 and-30)). Genes in the transendothelial migration of leukocytes (TEML) pathway were overrepresented in all three clusters, referred to as the atherosclerosis module (A-module). In a second validation step, using three independent cohorts, the A-module was found to be genetically enriched with CAD risk by 1.8-fold (P<0.004). The transcription co-factor LIM domain binding 2 (LDB2) was identified as a potential high-hierarchy regulator of the A-module, a notion supported by subnetwork analysis, by cellular and lesion expression of LDB2, and by the expression of 13 TEML genes in Ldb2-deficient arterial wall. Thus, the A-module appears to be important for atherosclerosis development and, together with LDB2, merits further attention in CAD research.
Conflict of interest statement
Clinical Gene Networks AB with Johan Björkegren and Jesper Tegnér as major shareholders has filed a PCT application for a screening method using genes in the atherosclerosis module including LDB2 (PCT/SE2007/00864).
Figures
Similar articles
-
Lim domain binding 2: a key driver of transendothelial migration of leukocytes and atherosclerosis.Arterioscler Thromb Vasc Biol. 2014 Sep;34(9):2068-77. doi: 10.1161/ATVBAHA.113.302709. Epub 2014 Jun 12. Arterioscler Thromb Vasc Biol. 2014. PMID: 24925974
-
Down-regulated RGS5 by genetic variants impairs endothelial cell function and contributes to coronary artery disease.Cardiovasc Res. 2021 Jan 1;117(1):240-255. doi: 10.1093/cvr/cvz268. Cardiovasc Res. 2021. PMID: 31605122
-
An integrated genomic-transcriptomic approach supports a role for the proto-oncogene BCL3 in atherosclerosis.Thromb Haemost. 2015 Mar;113(3):655-63. doi: 10.1160/TH14-05-0466. Epub 2014 Nov 6. Thromb Haemost. 2015. PMID: 25374339
-
Atherosclerosis pathophysiology and the role of novel risk factors: a clinicobiochemical perspective.Angiology. 2007 Oct-Nov;58(5):513-22. doi: 10.1177/0003319707303443. Angiology. 2007. PMID: 18024933 Review.
-
Sex differences in the genetic and molecular mechanisms of coronary artery disease.Atherosclerosis. 2023 Nov;384:117279. doi: 10.1016/j.atherosclerosis.2023.117279. Epub 2023 Oct 5. Atherosclerosis. 2023. PMID: 37805337 Review.
Cited by
-
Adipose tissue in health and disease through the lens of its building blocks.Sci Rep. 2020 Jun 26;10(1):10433. doi: 10.1038/s41598-020-67177-1. Sci Rep. 2020. PMID: 32591560 Free PMC article.
-
Effects of statin on circulating microRNAome and predicted function regulatory network in patients with unstable angina.BMC Med Genomics. 2015 Mar 13;8:12. doi: 10.1186/s12920-015-0082-4. BMC Med Genomics. 2015. PMID: 25889164 Free PMC article.
-
Sex-Stratified Gene Regulatory Networks Reveal Female Key Driver Genes of Atherosclerosis Involved in Smooth Muscle Cell Phenotype Switching.Circulation. 2021 Feb 16;143(7):713-726. doi: 10.1161/CIRCULATIONAHA.120.051231. Epub 2021 Jan 27. Circulation. 2021. PMID: 33499648 Free PMC article.
-
Genetic Susceptibility Loci for Cardiovascular Disease and Their Impact on Atherosclerotic Plaques.Circ Genom Precis Med. 2018 Sep;11(9):e002115. doi: 10.1161/CIRCGEN.118.002115. Circ Genom Precis Med. 2018. PMID: 30354329 Free PMC article.
-
Identification of Key lncRNAs Associated With Atherosclerosis Progression Based on Public Datasets.Front Genet. 2019 Feb 28;10:123. doi: 10.3389/fgene.2019.00123. eCollection 2019. Front Genet. 2019. PMID: 30873207 Free PMC article.
References
-
- Ginsburg GS, Donahue MP, Newby LK. Prospects for personalized cardiovascular medicine: the impact of genomics. J Am Coll Cardiol. 2005;46:1615–1627. - PubMed
-
- Schadt EE, Sachs A, Friend S. Embracing complexity, inching closer to reality. Sci STKE. 2005;2005:pe40. - PubMed
-
- Tegner J, Skogsberg J, Bjorkegren J. Thematic review series: systems biology approaches to metabolic and cardiovascular disorders. Multi-organ whole-genome measurements and reverse engineering to uncover gene networks underlying complex traits. J Lipid Res. 2007;48:267–277. - PubMed
-
- Blatt M, Wiseman S, Domany E. Superparamagnetic clustering of data. Phys Rev Lett. 1996;76:3251–3254. - PubMed
Publication types
MeSH terms
Substances
LinkOut - more resources
Full Text Sources
Medical
Molecular Biology Databases
Miscellaneous
