. 2009 Dec 4;4(12):e7682.
doi: 10.1371/journal.pone.0007682.

Expression of genes encoding multi-transmembrane proteins in specific primate taste cell populations

Affiliations

Expression of genes encoding multi-transmembrane proteins in specific primate taste cell populations

Bryan D Moyer et al. PLoS One. .

Abstract

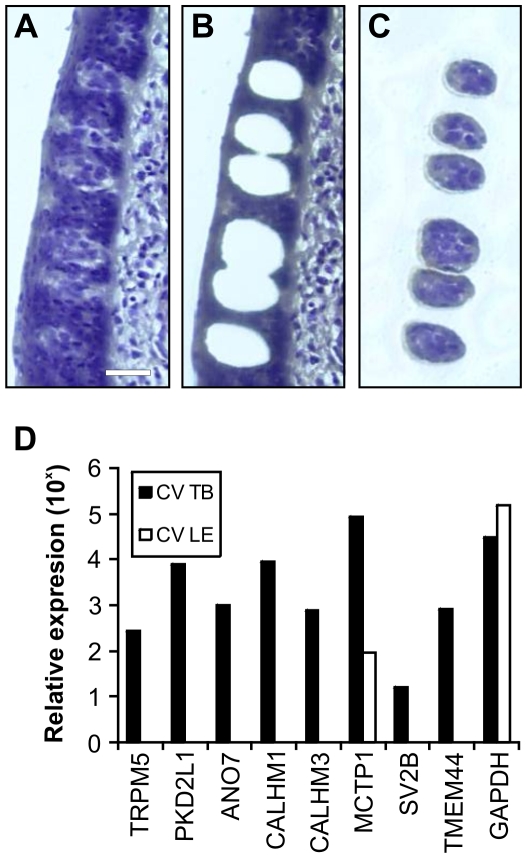
Background: Using fungiform (FG) and circumvallate (CV) taste buds isolated by laser capture microdissection and analyzed using gene arrays, we previously constructed a comprehensive database of gene expression in primates, which revealed over 2,300 taste bud-associated genes. Bioinformatics analyses identified hundreds of genes predicted to encode multi-transmembrane domain proteins with no previous association with taste function. A first step in elucidating the roles these gene products play in gustation is to identify the specific taste cell types in which they are expressed.

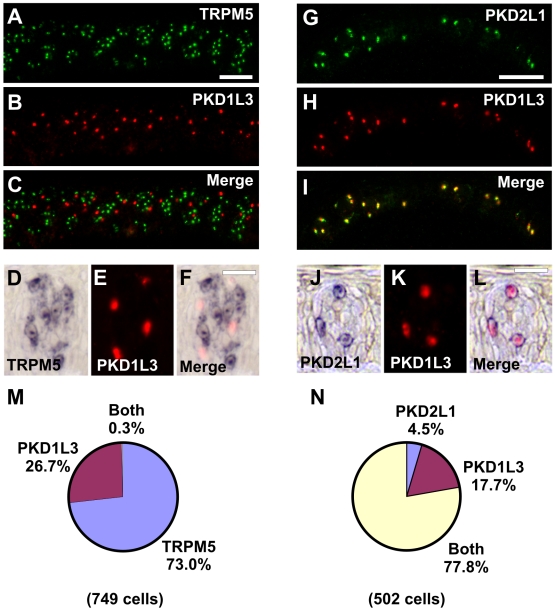
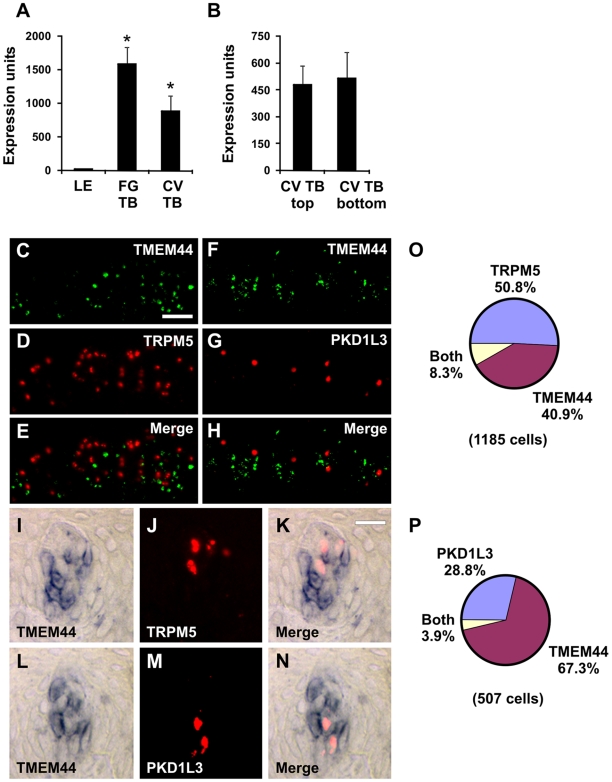
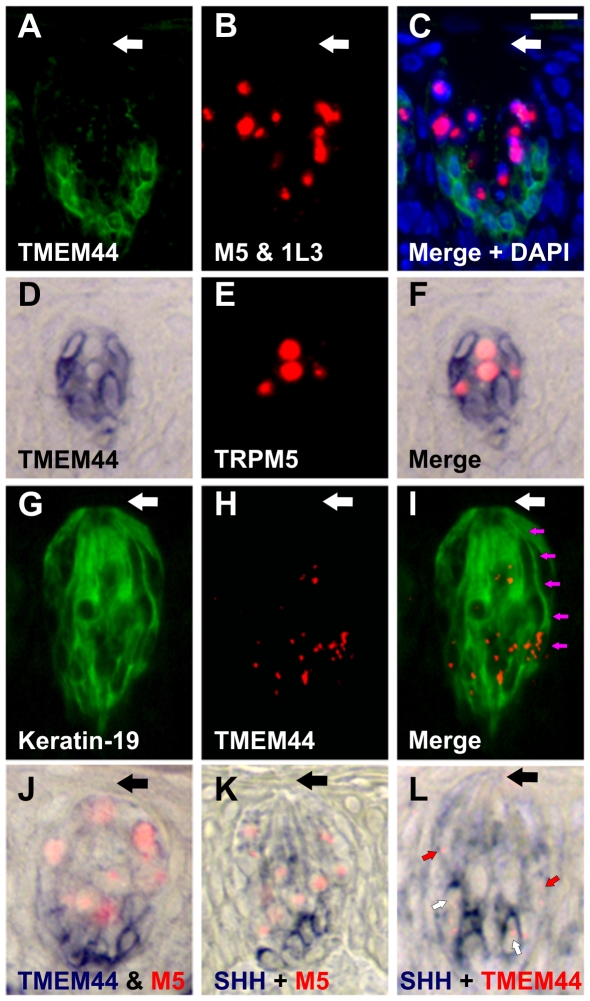
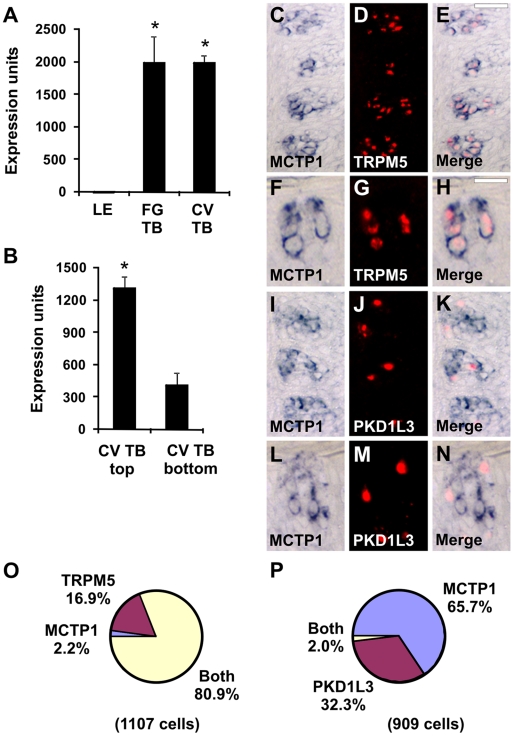
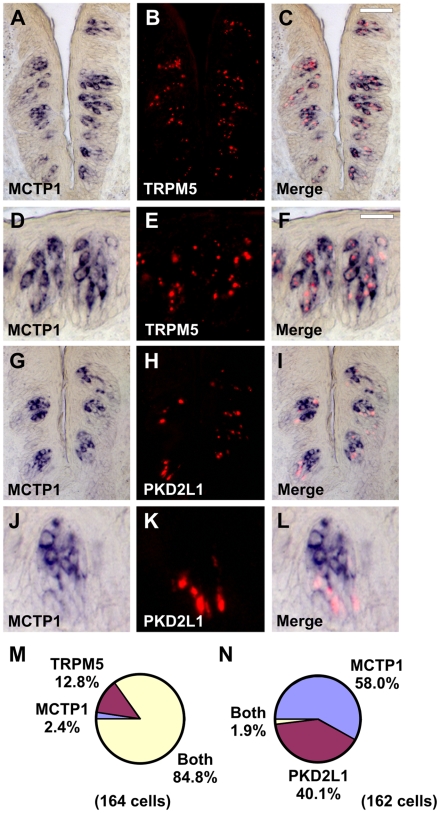
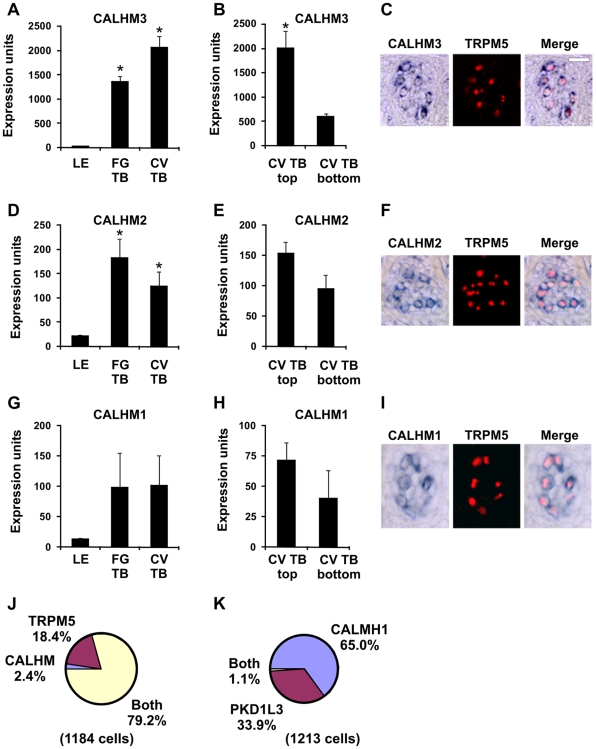
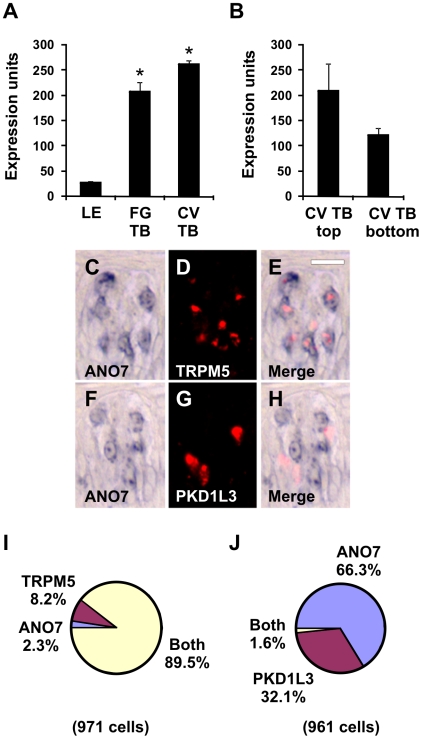
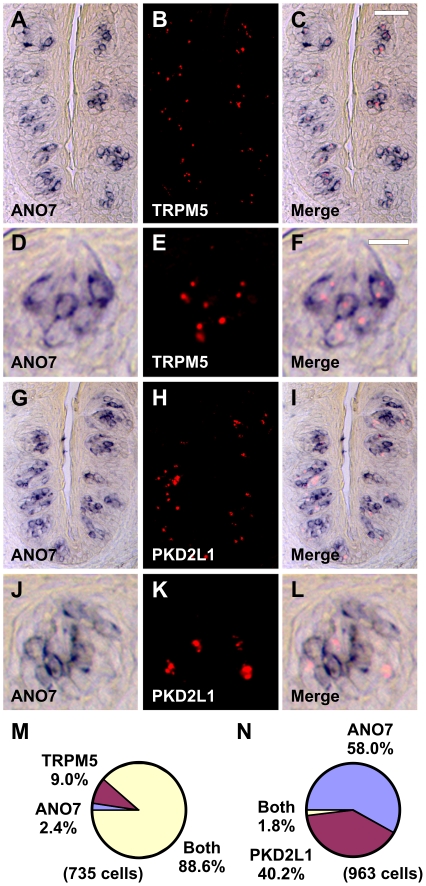
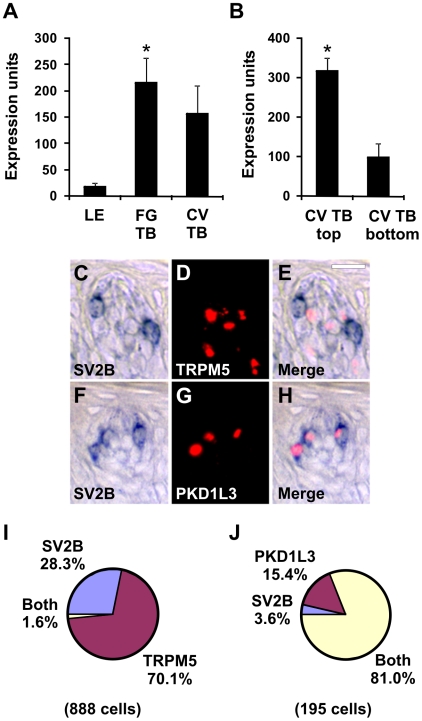
Methodology/principal findings: Using double label in situ hybridization analyses, we identified seven new genes expressed in specific taste cell types, including sweet, bitter, and umami cells (TRPM5-positive), sour cells (PKD2L1-positive), as well as other taste cell populations. Transmembrane protein 44 (TMEM44), a protein with seven predicted transmembrane domains with no homology to GPCRs, is expressed in a TRPM5-negative and PKD2L1-negative population that is enriched in the bottom portion of taste buds and may represent developmentally immature taste cells. Calcium homeostasis modulator 1 (CALHM1), a component of a novel calcium channel, along with family members CALHM2 and CALHM3; multiple C2 domains; transmembrane 1 (MCTP1), a calcium-binding transmembrane protein; and anoctamin 7 (ANO7), a member of the recently identified calcium-gated chloride channel family, are all expressed in TRPM5 cells. These proteins may modulate and effect calcium signalling stemming from sweet, bitter, and umami receptor activation. Synaptic vesicle glycoprotein 2B (SV2B), a regulator of synaptic vesicle exocytosis, is expressed in PKD2L1 cells, suggesting that this taste cell population transmits tastant information to gustatory afferent nerve fibers via exocytic neurotransmitter release.

Conclusions/significance: Identification of genes encoding multi-transmembrane domain proteins expressed in primate taste buds provides new insights into the processes of taste cell development, signal transduction, and information coding. Discrete taste cell populations exhibit highly specific gene expression patterns, supporting a model whereby each mature taste receptor cell is responsible for sensing, transmitting, and coding a specific taste quality.


Conflict of interest statement

Competing Interests: The project was supported by Senomyx, Inc. and all authors were full time employees of Senomyx, Inc. during project conception and data generation. Senomyx supported the research (purchased equipment, reagents, and supplies), and Senomyx employees were involved in study design, data collection and analysis, preparation of the manuscript, and decision to publish. P. Hevezi and A. Zlotnik are no longer full time employees of Senomyx, Inc. but continue to consult for the company. The following patent is relevant to work described in the paper: WO 2008/15394 A2. Rationale, methods, and assays for identifying human and non-human primate taste specific genes and use thereof in taste modulator and therapeutic screening assays.

Figures

Figure 1
Figure 1. Identification of distinct taste cell populations by histology.
A–F, Double label in situ hybridization (ISH) for TRPM5 and PKD1L3. TRPM5 (A, D) and PKD1L3 (B, E) are expressed in different cells in the merged images (C, F). G–L, Double label ISH for PKD2L1 and PKD1L3. PKD2L1 (G, J) and PKD1L3 (H, K) are expressed in similar cells in the merged images (I, L). Identical results were obtained using double label fluorescent ISH (A–C and G–I) or double label colorimetric-fluorescent ISH (D–F and J–L). Double label fluorescent ISH images show multiple taste buds whereas double label colorimetric-fluorescent ISH images show a single taste bud. Scale bar is 40µm in A and represents scale for A–C and G–I, 20µm in F and represents scale for D–F and J–L. Images are from primate CV papilla. M, Pie chart illustrating fraction of cells expressing TRPM5, PKD1L3, or both TRPM5 and PKD1L3. N, Pie chart illustrating fraction of cells expressing PKD2L1, PKD1L3, or both PKD2L1 and PKD1L3.
Figure 2
Figure 2. TMEM44 is not expressed in sweet, bitter, umami, and sour cells.
Expression of TMEM44 in LE, FG TB, and CV TB (A) as well as top and bottom portions of CV TB (B) by microarray analyses. * p<0.05 compared to LE. Expression units are GC-RMA normalized average intensities of microarray signals. Double label in situ hybridization (ISH) for TMEM44 and TRPM5 (C–E and I–K). TMEM44 (C, I) and TRPM5 (D, J) are expressed in different cells in the merged images (E, K). Identical results were obtained in CV (C–E) or FG taste buds (I–K). Double label ISH for TMEM44 and PKD1L3 (F–H and L–N). TMEM44 (F, L) and PKD1L3 (G, M) are expressed in different cells in the merged images (H, N). Identical results were obtained in primate CV (F–H) or FG taste buds (L–N). Scale bar is 30µm in C and represents scale for C–H. Scale bar is 20µm in K and represents scale for I–N. Images are oblique sections with varying orientations from primate CV papilla. O, Pie chart illustrating fraction of cells expressing TMEM44, TRPM5, or both TMEM44 and TRPM5. P, Pie chart illustrating fraction of cells expressing TMEM44, PKD1L3, or both TMEM44 and PKD1L3.
Figure 3
Figure 3. TMEM44 cells localize to the bottom and sides of taste buds.
Double label in situ hybridization (ISH) for TMEM44 and TRPM5/PKD1L3 in CV taste bud; longitudinal section (A–C). TMEM44 cells (A) are enriched towards the base and sides of taste buds whereas TRPM5/PKD1L3 cells (B) are enriched toward the center and top of taste buds. A merged image with nuclei stained blue (DAPI, C) highlights these signals in a longitudinal section. Double label ISH for TMEM44 and TRPM5 in FG taste bud; tangential section in middle of taste bud (D–F). TMEM44 cells (D) surround TRPM5 cells (E) in merged image (F). Some TMEM44 cells extend processes toward the taste pore (G–I). Double label IHC-ISH for Keratin-19 (G, IHC), TMEM44 (H, ISH) and merge (I) in CV taste bud (longitudinal section). Pink arrows track a TMEM44 cell process towards the taste pore. Double label ISH for TMEM44 (blue) with TRPM5 (red) (J), SHH (blue) with TRPM5 (red) (K), and SHH (blue) with TMEM44 (red) (L) in primate CV taste buds (longitudinal sections). Small white arrows denote cells that express both TMEM44 and SHH transcripts, whereas small red arrows denote cells that express only TMEM44 transcripts. Large arrows denote taste pore region. Note that TMEM44 stain in panel A is a colorimetric signal (DIG-labeled ISH probe) that is pseudocolored green, whereas the TMEM44 stain in panel H is a fluorescent signal (FITC-labeled ISH probe). Colorimetric signals highlight the nuclear envelope and cytoplasm whereas fluorescent signals highlight intranuclear regions. Scale bar is 20µm in C and represents scale for A–L.
Figure 4
Figure 4. MCTP1 is expressed in TRPM5 cells.
Expression of MCTP1 in LE, FG TB, and CV TB (A) as well as top and bottom portions of CV TB (B) by microarray analyses. * p<0.005 compared to LE (A) or CV TB bottom (B). Expression units are GC-RMA normalized average intensities of microarray signals. Double label in situ hybridization (ISH) for MCTP1 and TRPM5 (C–H). MCTP1 (C, F) and TRPM5 (D, G) are expressed in similar cells in the merged images (E, H). Double label ISH for MCTP1 and PKD1L3 (I–N). MCTP1 (I, L) and PKD1L3 (J, M) are expressed in different cells in the merged images (K, N). Single taste buds are illustrated in F–H and L–N. Scale bar is 30µm in E and represents scale for C–E and I–K. Scale bar is 25µm in H and represents scale for F–H and L–N. Images are from primate CV papilla. O, Pie chart illustrating fraction of cells expressing MCTP1, TRPM5, or both MCTP1 and TRPM5. Cells with only TRPM5 signals may contain MCTP1 transcripts below the detection limit of ISH. P, Pie chart illustrating fraction of cells expressing MCTP1, PKD1L3, or both MCTP1 and PKD1L3.
Figure 5
Figure 5. MCTP1 is expressed in TRPM5 cells in mouse.
Double label in situ hybridization (ISH) for MCTP1 and TRPM5 (A–F). MCTP1 (A, D) and TRPM5 (B, E) are expressed in similar cells in the merged images (C, F). Double label ISH for MCTP1 and PKD2L1 (G–L). MCTP1 (G, J) and PKD2L1 (H, K) are expressed in different cells in the merged images (I, L). Images in D–F and J–L depict single taste buds at higher magnification. Scale bar is 40µm in C and represents scale for A–C and G–I. Scale bar is 25µm in F and represents scale for D–F and J–L. Images are from mouse CV papilla. M, Pie chart illustrating fraction of cells expressing MCTP1, TRPM5, or both MCTP1 and TRPM5. N, Pie chart illustrating fraction of cells expressing MCTP1, PKD2L1, or both MCTP1 and PKD2L1.
Figure 6
Figure 6. CALHM1, 2, and 3 are expressed in TRPM5 cells.
Expression of CALHM3 (A–B), CALHM2 (D–E), and CALHM1 (G–H) in LE, FG TB, and CV TB as well as top and bottom portions of CV TB by microarray analyses. For CALHM3, * p<0.005 compared to LE (A) or p<0.05 compared to CV TB bottom (B); for CALHM2, * p<0.05 compared to LE (D); for CALHM1, p<0.05 for CV top compared to LE. Expression units are GC-RMA normalized average intensities of microarray signals. Double label in situ hybridization (ISH) for CALHM3 with TRPM5 (C), CALHM2 with TRPM5 (F), and CALHM1 with TRPM5 (I), illustrating that CALHM 1, 2, and 3 are expressed in TRPM5 cells. Scale bar is 20µm in C and represents scale for C, F, and I. Images are from primate CV papilla. J, Pie chart illustrating fraction of cells expressing CALHM, TRPM5, or both CALHM and TRPM5. Since results were similar for CALHM1, CALHM2, and CALHM3, data were pooled. Individually, there were 2.5% CALHM1 cells, 18.1% TRPM5 cells, and 79.4% of cells expressing both CALHM1 and TRPM5 cells; 3.2% CALHM2 cells, 21.5% TRPM5 cells, and 75.3% of cells expressing both CALHM2 and TRPM5; 0.6% CALHM3 cells; 15.1% TRPM5 cells, and 84.5% of cells expressing both CALHM3 and TRPM5. Cells with only TRPM5 signals may contain CALHM transcripts below the detection limit of ISH. P, Pie chart illustrating fraction of cells expressing CALHM1, PKD1L3, or both CALHM1and PKD1L3.
Figure 7
Figure 7. ANO7 is expressed in TRPM5 cells.
Expression of ANO7 in LE, FG TB, and CV TB (A) as well as top and bottom portions of CV TB (B) by microarray analyses. * p<0.005 compared to LE (A). Expression units are GC-RMA normalized average intensities of microarray signals. Double label in situ hybridization (ISH) for ANO7 and TRPM5 (C–E). ANO7 (C) and TRPM5 (D) are expressed in similar cells in the merged image (E). Double label ISH for ANO7 and PKD1L3 (F–H). ANO7 (F) and PKD1L3 (G) are expressed in different cells in the merged image (H). Images are from primate CV taste buds. Scale bar is 15µm in E and represents scale for C–H. I, Pie chart illustrating fraction of cells expressing ANO7, TRPM5, or both ANO7 and TRPM5. J, Pie chart illustrating fraction of cells expressing ANO7, PKD1L3, or both ANO7 and PKD1L3.
Figure 8
Figure 8. ANO7 is expressed in TRPM5 cells in mouse.
Double label in situ hybridization (ISH) for ANO7 and TRPM5 (A–F). ANO7 (A, D) and TRPM5 (B, E) are expressed in similar cells in the merged images (C, F). Double label ISH for ANO7 and PKD2L1 (G–L). ANO7 (G, J) and PKD2L1 (H, K) are expressed in different cells in the merged images (I, L). Images in D–F and J–L depict single taste buds at higher magnification. Scale bar is 40µm in C and represents scale for A–C and G–I. Scale bar is 10µm in F and represents scale for D–F and J–L. Images are from mouse CV papilla. M, Pie chart illustrating fraction of cells expressing ANO7, TRPM5, or both ANO7 and TRPM5. N, Pie chart illustrating fraction of cells expressing ANO7, PKD2L1, or both ANO7 and PKD2L1.
Figure 9
Figure 9. SV2B is expressed in PKD1L3 cells.
Expression of SV2B in LE, FG TB, and CV TB (A) as well as top and bottom portions of CV TB (B) by microarray analyses. * p<0.01 compared to LE (A) or CB TB bottom (B). Expression units are GC-RMA normalized average intensities of microarray signals. Double label in situ hybridization (ISH) for SV2B and TRPM5 (C–E). SV2B (C) and TRPM5 (D) are expressed in different cells in the merged image (E). Double label ISH for SV2B and PKD1L3 (F–H). SV2B (F) and PKD1L3 (G) are expressed in similar cell types in the merged image (H). Images are from primate CV taste buds. Scale bar is 20µm in E and represents scale for C–H. I, Pie chart illustrating fraction of cells expressing SV2B, TRPM5, or both SV2B and TRPM5. J, Pie chart illustrating fraction of cells expressing SV2B, PKD1L3, or both SV2B and PKD1L3. Cells with only PKD1L3 signals may contain SV2B transcripts below the detection limit of ISH.
Figure 10
Figure 10. Genes encoding transmembrane proteins are expressed in human CV taste buds.
Section of human CV papilla before (A) and after (B) laser capture microdissection of taste buds. Collected taste bud regions (C), were isolated from CV papilla and used for molecular analysis of gene expression. A laser beam was used to cut the perimeter of taste buds and physically separate them from surrounding lingual epithelium. Taste buds were next lifted away from the tissue section with an adhesive cap. Panel C is an image of six isolated taste bud regions, devoid of surrounding lingual epithelium and connective tissue, on the adhesive cap. Scale bar is 40µm. Semi-quantitative PCR (D) for known taste genes (TRPM5 and PKD2L1), genes predicted or known to encode transmembrane proteins, and the housekeeping gene GAPDH in isolated CV taste buds (black bars) or non-gustatory lingual epithelium (white bars) collected by laser capture microdissection. Relative expression is shown on a logarithmic scale.

Similar articles

Cited by

References

    1. Breslin PA, Huang L. Human taste: peripheral anatomy, taste transduction, and coding. Adv Otorhinolaryngol. 2006;63:152–190. - PubMed
    1. Bachmanov AA, Beauchamp GK. Taste receptor genes. Annu Rev Nutr. 2007;27:389–414. - PMC - PubMed
    1. Chandrashekar J, Hoon MA, Ryba NJ, Zuker CS. The receptors and cells for mammalian taste. Nature. 2006;444:288–294. - PubMed
    1. Huang AL, Chen X, Hoon MA, Chandrashekar J, Guo W, et al. The cells and logic for mammalian sour taste detection. Nature. 2006;442:934–938. - PMC - PubMed
    1. Ishimaru Y, Inada H, Kubota M, Zhuang H, Tominaga M, et al. Transient receptor potential family members PKD1L3 and PKD2L1 form a candidate sour taste receptor. Proc Natl Acad Sci U S A. 2006;103:12569–12574. - PMC - PubMed

Publication types

MeSH terms