

Structural brain differences and cognitive functioning related to body mass index in older females
- PMID: 19998366
- PMCID: PMC6870943
- DOI: 10.1002/hbm.20916
Structural brain differences and cognitive functioning related to body mass index in older females
Abstract
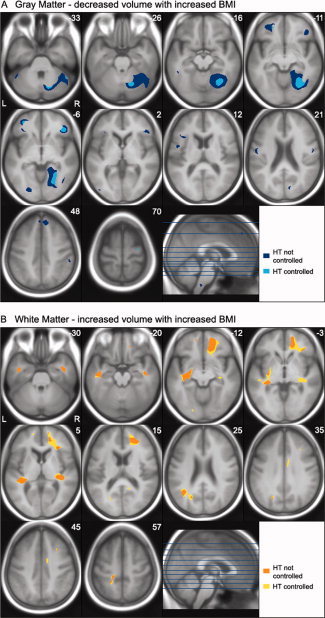
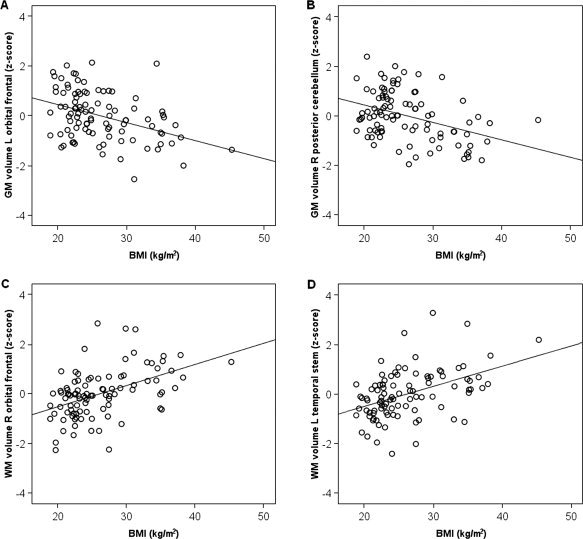
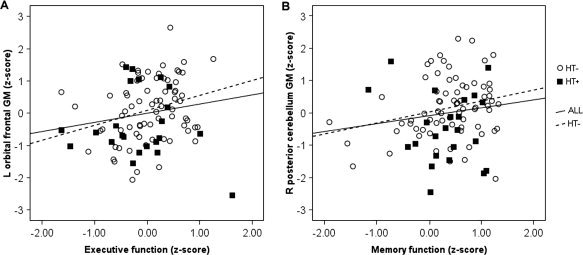
Little is known about the effect of obesity on brain structures and cognition in healthy older adults. This study examined the association between body mass index (BMI), regional volume differences in gray and white matter measured by magnetic resonance imaging (MRI), and cognitive functioning in older females. Participants included 95 community-dwelling older females (ages 52-92 years) who underwent extensive neuropsychological testing and high-resolution MRI scanning. Optimized voxel-based morphometry techniques were employed to determine the correlation between BMI and regional gray and white matter volumes. Volumes of significant regions were then correlated with cognitive functioning. Higher BMI was associated with decreased gray matter volumes in the left orbitofrontal, right inferior frontal, and right precentral gyri, a right posterior region including the parahippocampal, fusiform, and lingual gyri, and right cerebellar regions, as well as increased volumes of white matter in the frontal, temporal, and parietal lobes, even when hypertension was considered. Compared to normal weight women, obese women performed poorer on tests of executive functioning. Smaller gray matter volume in the left orbitofrontal region was associated with lower executive functioning. Additionally, despite the lack of significant group differences in memory and visuomotor speed, gray and white matter volumes predicted performance on these measures. The results provide additional evidence for a negative link between increased body fat and brain functioning in older females.
(c) 2009 Wiley-Liss, Inc.
Figures
References
-
- Alkan A, Sahin I, Keskin L, Cikim AS, Karakas HM, Sigirci A, Erdem G ( 2008): Diffusion‐weighted imaging features of brain in obesity. Magn Reson Imaging 26: 446–450. - PubMed
-
- Ashburner J, Friston KJ ( 2000): Voxel‐based morphometry—The methods. Neuroimage 11: 805–821. - PubMed
-
- Boeka AG, Lokken KL ( 2008): Neuropsychological performance of a clinical sample of extremely obese individuals. Arch Clin Neuropsychol 23: 467–474. - PubMed
-
- Boccardi M, Ghidoni R, Govoni S, Testa C, Benussi L, Bonetti M, Binetti G, Frisoni GB ( 2006): Effects of hormone therapy on brain morphology of healthy postmenopausal women: A voxel‐based morphometry study. Menopause 13: 584–591. - PubMed
-
- Chen X, Wen W, Anstey KJ, Sachdev PS ( 2006): Effects of cerebrovascular risk factors on gray matter volume in adults aged 60–64 years: A voxel‐based morphometric study. Psychiatry Res 147: 105–114. - PubMed
Publication types
MeSH terms
LinkOut - more resources
Full Text Sources
Other Literature Sources
Medical
