. 2010 Apr 15;58(6):650-64.
doi: 10.1002/glia.20952.

Interactions between TLR7 and TLR9 agonists and receptors regulate innate immune responses by astrocytes and microglia

Affiliations

Interactions between TLR7 and TLR9 agonists and receptors regulate innate immune responses by astrocytes and microglia

Niranjan B Butchi et al. Glia. .

Abstract

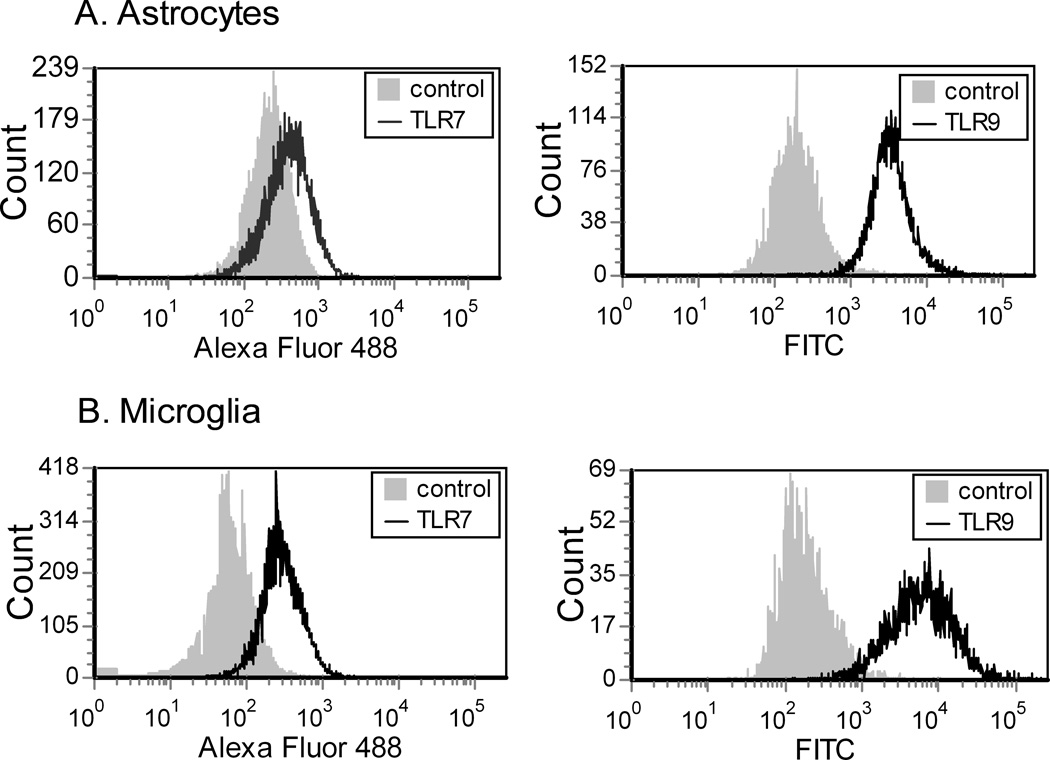
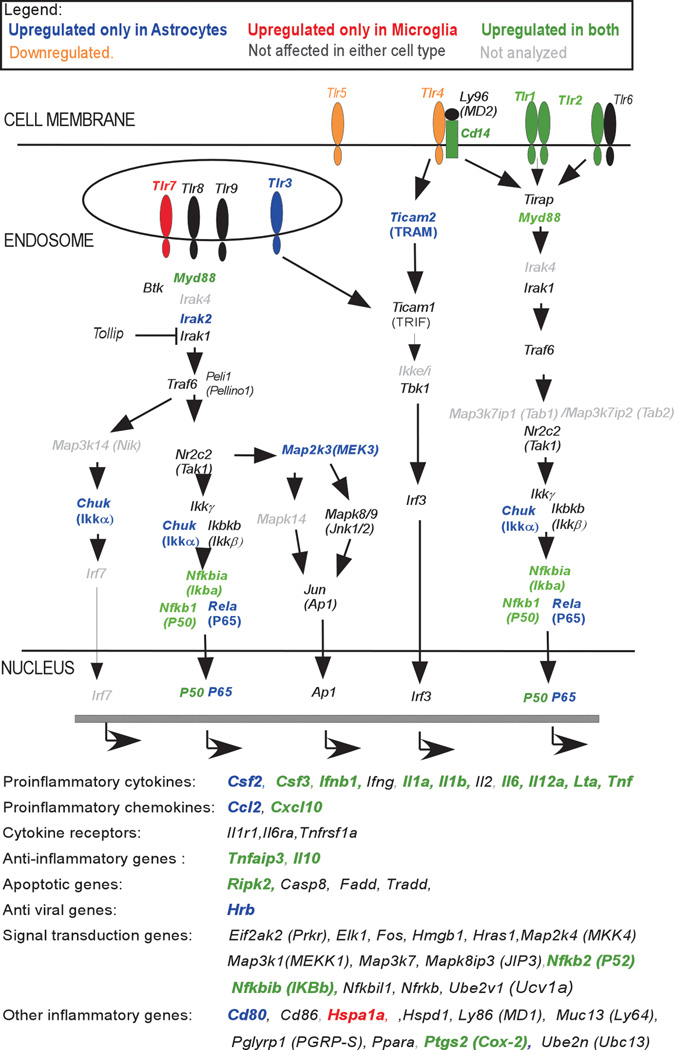
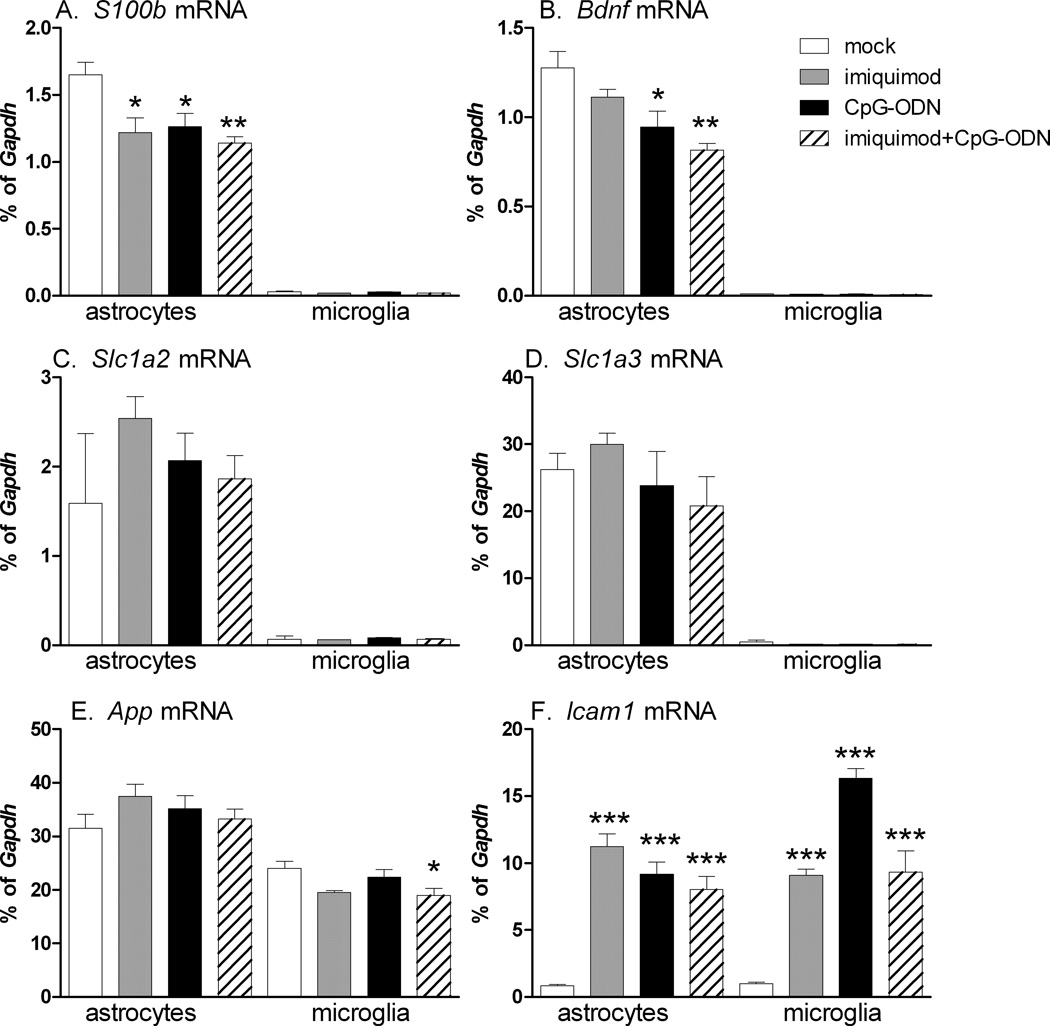
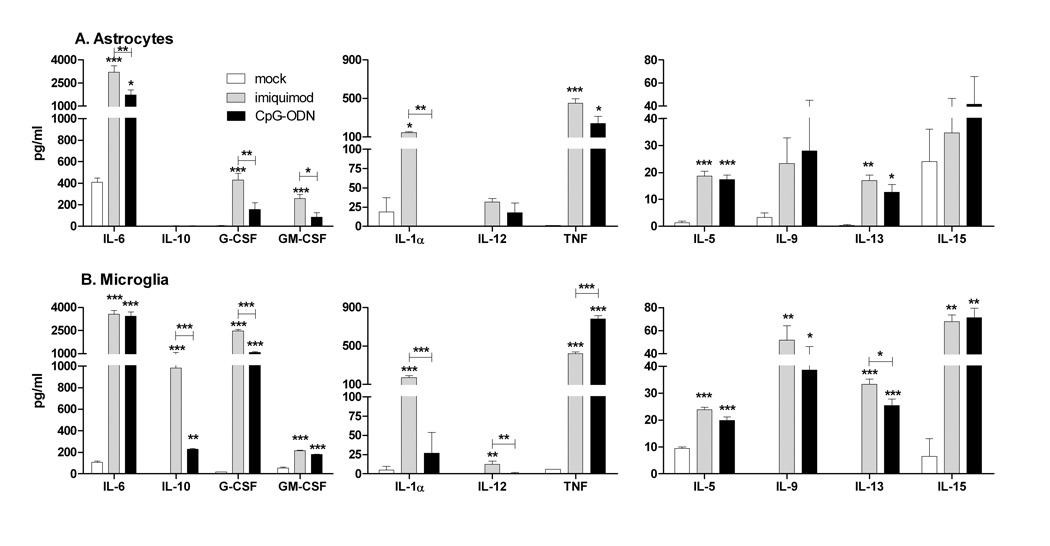
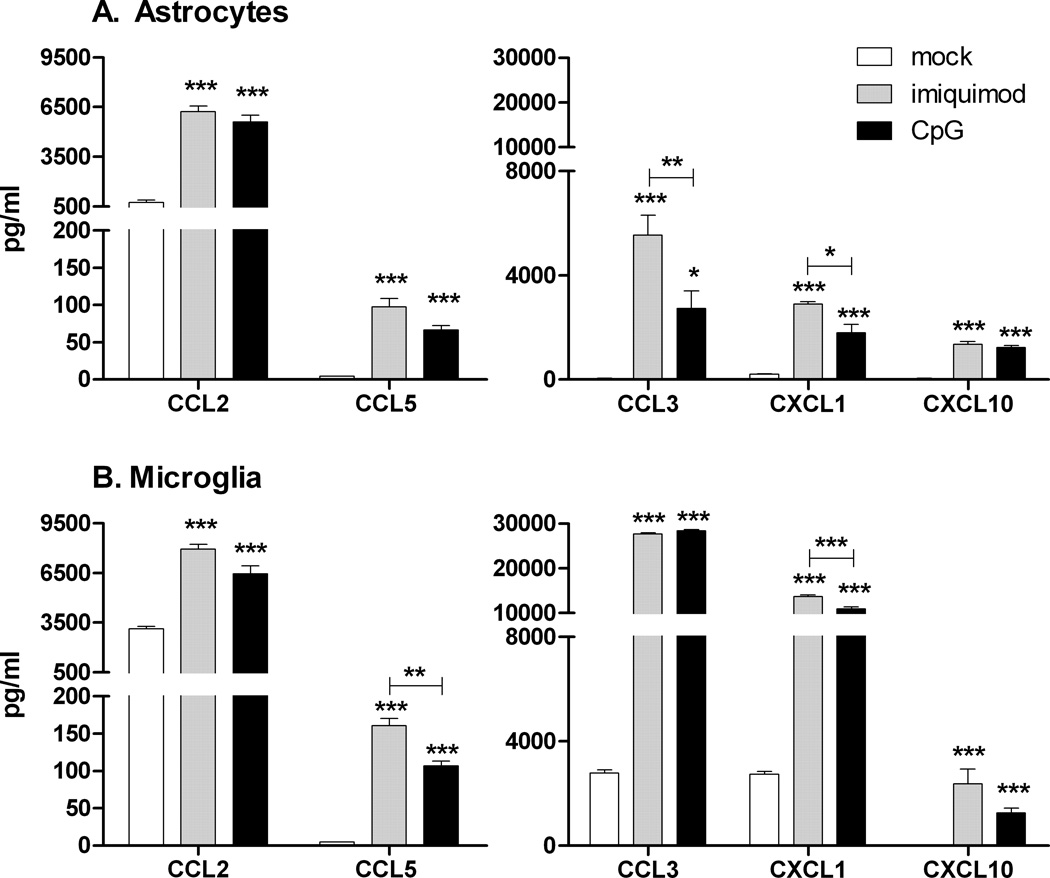
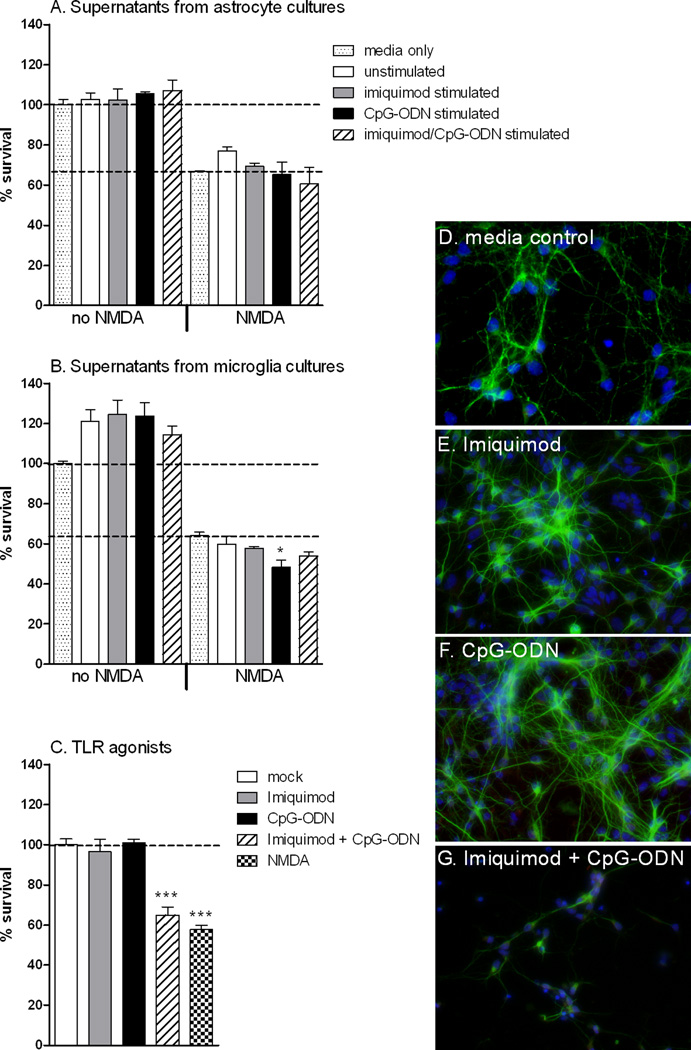
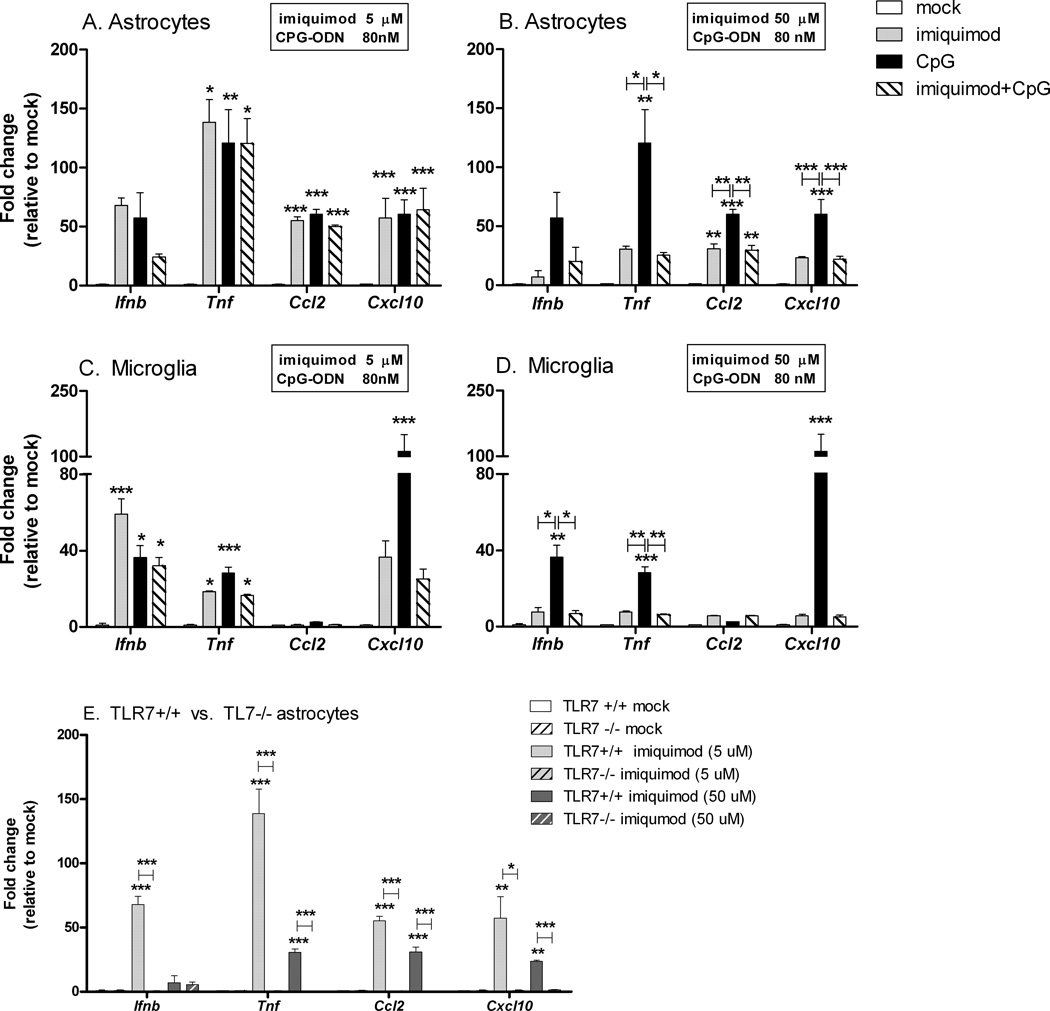
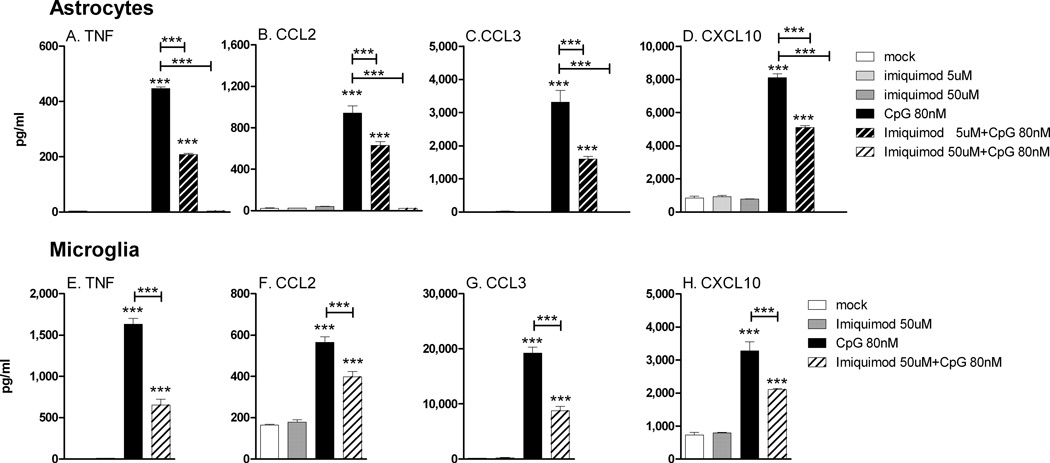
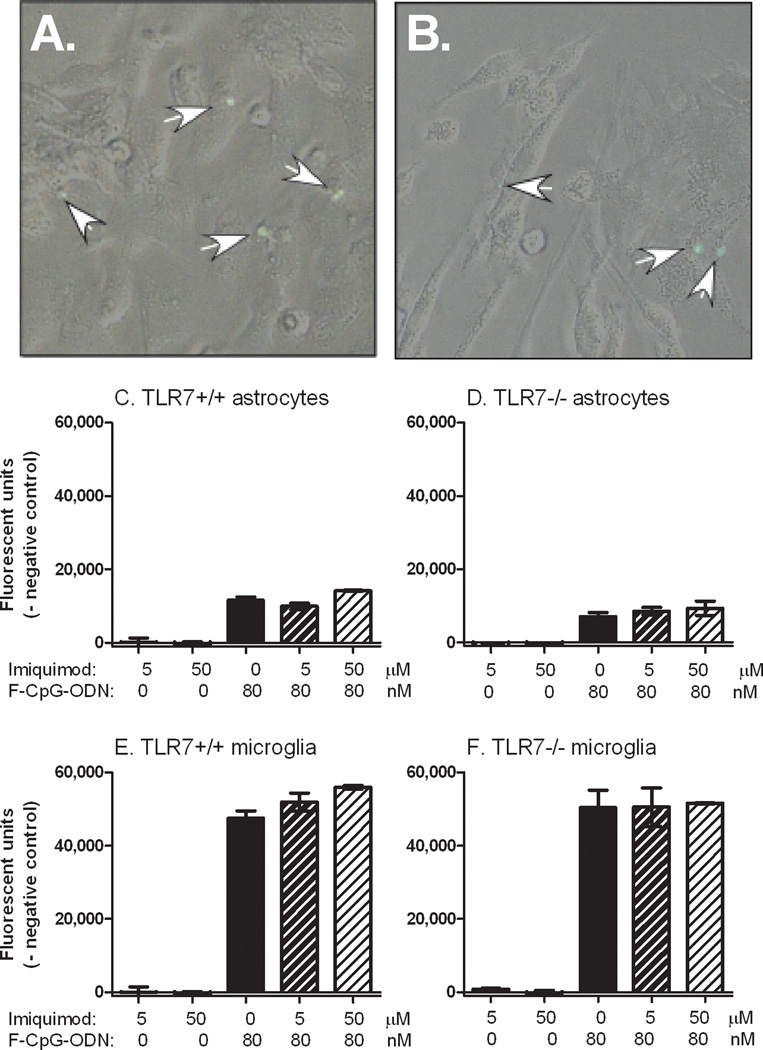
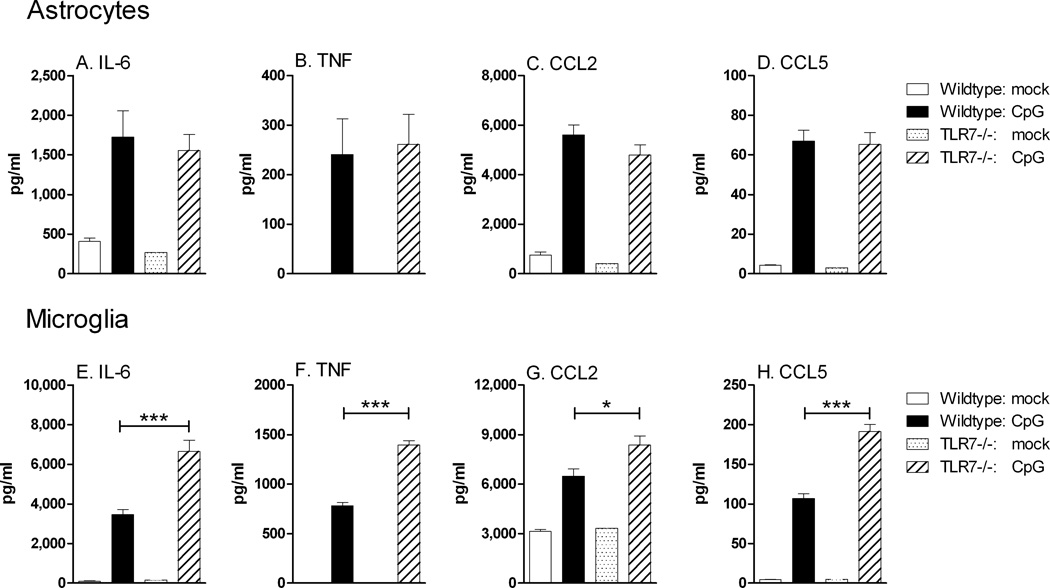
Toll-like receptors 7 (TLR7) and 9 (TLR9) are important mediators of innate immune responses. Both receptors are located in endosomal compartments, recognize nucleic acids, and signal via Myeloid differentiation factor 88 (MyD88). In the current study, we analyzed TLR7 and TLR9 induced activation of astrocytes and microglia, two cell types that contribute to innate immune responses in the CNS. TLR7 and TLR9 agonists induced similar cytokine profiles within each cell type. However, there were notable differences in the cytokine profile between astrocytes and microglia, including the production of the anti-inflammatory cytokine IL-10 and antiapoptotic cytokines G-CSF and IL-9 by microglia but not astrocytes. Costimulation studies demonstrated that the TLR7 agonist, imiquimod, could inhibit TLR9 agonist-induced innate immune responses, in both cell types, in a concentration-dependent manner. Surprisingly, this inhibition was not mediated by TLR7, as deficiency in TLR7 did not alter suppression of the TLR9 agonist-induced responses. The suppression of innate immune responses was also not due to an inhibition of TLR9 agonist uptake. This suggested that imiquimod suppression may be a direct effect, possibly by blocking CpG-ODN binding and/or signaling with TLR9, thus limiting cell activation. An antagonistic relationship was also observed between the two receptors in microglia, with TLR7 deficiency resulting in enhanced cytokine responses to CpG-ODN stimulation. Thus, both TLR7 and its agonist can have inhibitory effects on TLR9-induced cytokine responses in glial cells.


Figures

Fig. 1
Fig. 1. Expression of TLR7 and TLR9 on primary astrocytes and microglia
(A) astrocyte and (B) microglia cultures were analyzed for expression of TLR7 and TLR9 by flow cytometry. Data are shown as a histogram with fluorescence intensity on X-axis and counts/cell numbers on Y-axis. For detection of TLR7, cells were incubated with Alexa Flour 488 conjugated goat anti-rabbit, either with rabbit anti-TLR7 (TLR7) or with no primary antibody (control). The mean fluoresce intensity (MFI) was substantially higher for TLR7-stained astrocytes (470, 349) than for the no primary antibody controls (269, 211) demonstrating that astrocytes expressed TLR7 protein, albeit at low levels. For detection of TLR9, cells were stained with a FITC- conjugated mouse-IgG (control) or with mouse anti-TLR9 and FITC-conjugated anti-mouse IgG (TLR9). Data are representative of two replicate experiments.
Fig. 2
Fig. 2. Changes in mRNA expression following TLR7 and/or TLR9 agonist stimulation in astrocytes and microglia
Cultured astrocytes and microglia were stimulated with 5 µM imiquimod or 80 nM CpG-ODN 1826 or both. RNA was isolated at 6 hps, reverse transcribed and cDNA was analyzed for mRNA expression by quantitative real-time PCR analysis using TLR signaling pathway array. Genes are presented as a schematic of their protein’s involvement in the TLR signaling cascade or as genes transcribed following the signaling cascade. Increased mRNA expression of these genes in both microglia and astrocytes is indicated by green lettering, in astrocytes only by bold blue lettering and in microglia only by bold red lettering. Tlr4 mRNA was downregulated in microglia, while Tlr5 mRNA was downregulated in both microglia and astrocytes. Genes indicated in black lettering were not altered in either cell type and in grey lettering were not analyzed for mRNA expression.
Fig. 3
Fig. 3. Influence of imiquimod or CpG-ODN or costimulation in astrocytes and microglia on the mRNA expression of (A) S100b, (B) Brain-derived neurotrophic factor (Bdnf), glutamate transporters (C) Slc1a2, (D) Slc1a3, (E) amyloid precursor protein (App) and (F) adhesion molecule (Icam1)
Cultured astrocytes and microglia were stimulated with 5 µM imiquimod or 80 nM CpG-ODN 1826 or both. At 6 hps, RNA was isolated, processed and analyzed by realtime RT PCR. Gene expression values were calculated as a percentage of Gapdh mRNA expression per sample. Data are the mean +/− SEM of three samples per group. Statistical analysis was completed by one-way ANOVA with Bonferroni post test. * P<0.05, ** p<0.01 and *** p< 0.001. Asterisks above bars indicated a significant upregulation compared to mock-treated controls. Data are representative of two replicate experiments.
Fig. 4
Fig. 4. Comparison of cytokine protein production by (A) astrocytes and (B) microglia stimulated with imiquimod or CpG-ODN
Cultured astrocytes and microglia were stimulated with mock or 5 µM imiquimod or 80 nM CpG-ODN 1826 for 12 hours. Supernatants were analyzed for cytokine protein production by multiplex bead array or by ELISA assay. Samples were calculated as pg/ml using a standard curve from in-plate standards. Data are the mean +/− SEM of 3 samples per group. Statistical analysis was completed by one-way ANOVA with Bonferroni post test. * P<0.05, ** p<0.01 and *** p< 0.001. Asterisks above bars indicated a significant upregulation compared to mock-treated controls. Lines with asterisks above the lines indicate the difference between the indicated groups. Data are representative of two replicate experiments.
Fig. 5
Fig. 5. Comparison of chemokine protein production by (A) astrocytes and (B) microglia stimulated with imiquimod or CpG-ODN
Cultured astrocytes and microglia were stimulated with 5 µM imiquimod or 80 nM CpG-ODN 1826 for 12 hours and supernatants were analyzed as described in Fig 4. Data are the mean +/− SEM of 3 samples per group. Statistical analysis was completed as described in Fig. 4. Data are representative of two replicate experiments.
Fig. 6
Fig. 6. Effect of TLR7 and TLR9 stimulated supernatants from astrocyte and microglia cultures, and the ligands on primary cortical neuron cultures
Cortical neurons were cultured for 4 hours following isolation and then cultured with media containing a 1:1 ratio of neurobasal media, containing all neuron growth factors, and supernatants from either (A) astrocyte or (B) microglia cultures in the presence or absence of NMDA. (C–H) Neurons were stimulated with 5 µM imiquimod or 80 nM CpG-ODN 1826 and/or NMDA as described in methods. Neuron cultures were incubated for 72 h and cell survival was measured by (A–C) MTT assay or (D–G) immunofluorescence staining for β-tubulin. Data are the mean +/− SEM of three to four samples per group. Statistical analysis was completed by one-way ANOVA with Dunnett’s multiple comparison test with mock controls. * P<0.05, *** p< 0.001. Asterisks above bars indicated a significant upregulation compared to mock-treated controls. Data are representative of two replicate experiments.
Fig. 7
Fig. 7. Costimulation with TLR7/TLR9 agonists inhibits TLR9 induced cytokine and chemokine mRNA expression in astrocytes and microglia
Cultured (A,B,E) astrocytes and (C,D) microglia were stimulated with either (A,C, E) 5 µM imiquimod or (B,D,E) 50 µM imiquimod and/or (A–D) 80 nM CpG-ODN 1826. (E) Stimulation of astrocytes generated from wildtype (TLR7+/+) and TLR7 deficient (TLR7−/−) mice to verify specificity of both concentrations of imiquimod. At 6 hps, RNA was isolated from all samples and processed for quantitative realtime RT-PCR. Samples were analyzed as described in Fig. 2. Data are the mean +/− SEM of 3–6 samples per group and present the combined data from two independent experiments. Statistical analysis was completed as described in Fig. 4.
Fig. 8
Fig. 8. TLR7 is not necessary for TLR7 agonist inhibition of TLR9-induced cytokine responses in (A–D) astrocytes or (E–H) microglia cultures
Astrocyte and microglia cultures from TLR7 deficient mice were stimulated with TLR7 and/or TLR9 agonists for 12h as shown in the figure and the supernatants were analyzed as described in Fig 4. Data are the mean +/− SEM of 3 samples per group. Statistical analysis was completed as described in Fig. 4. Data are representative of two replicate experiments.
Fig. 9
Fig. 9. TLR7 agonists do not inhibit the endocytosis of FITC labeled CpG-ODN into astrocytes or microglia
Astrocyte and microglia cultures at near confluency were incubated with 80 nM of FITC-labeled CpG-ODN and/or 5 to 50 µM of imiquimod for 30 min, and then washed extensively with PBS to remove unbound or non-internalized FITC-CpG ODN. FITC was detected in the cells of both (A) astrocytes and (B) microglia cultures (indicated by white arrows). Cells were then lysed and the level of fluorescence was measured using a microplate reader. Fluorescence levels in unstimulated astrocytes and microglia were used as a baseline for each culture. Data are the average of 3 wells per group for (C–D) astrocytes or (E–F) microglia cultures generated from (A–C,E) wildtype or (D,F) TLR7 deficient mice.
Fig. 10
Fig. 10. Effect of TLR7 deficiency on TLR9 induced cytokine and chemokine production. (A–D)
Astrocyte and (E–F) microglia cultures from wild type and TLR7 deficient mice were stimulated with mock control or 80 nM of CpG-ODN 1826 for 12h and the supernatants were analyzed as described in Fig 4. Data are the mean +/− SEM of 3 samples per group. Statistical analysis was completed as described in Fig. 4. Data are representative of two replicate experiments.

Similar articles

Cited by

References

    1. Asensio VC, Campbell IL. Chemokine gene expression in the brains of mice with lymphocytic choriomeningitis. J Virol. 1997;71:7832–7840. - PMC - PubMed
    1. Beignon AS, McKenna K, Skoberne M, Manches O, DaSilva I, Kavanagh DG, Larsson M, Gorelick RJ, Lifson JD, Bhardwaj N. Endocytosis of HIV-1 activates plasmacytoid dendritic cells via Toll-like receptor-viral RNA interactions. J Clin Invest. 2005;115:3265–3275. - PMC - PubMed
    1. Berghofer B, Haley G, Frommer T, Bein G, Hackstein H. Natural and synthetic TLR7 ligands inhibit CpG-A- and CpG-C-oligodeoxynucleotide-induced IFN-alpha production. J Immunol. 2007;178:4072–4079. - PubMed
    1. Bowman CC, Rasley A, Tranguch SL, Marriott I. Cultured astrocytes express toll-like receptors for bacterial products. Glia. 2003;43:281–291. - PubMed
    1. Butchi NB, Pourciau S, Du M, Morgan TW, Peterson KE. Analysis of the neuroinflammatory response to TLR7 stimulation in the brain: comparison of multiple TLR7 and/or TLR8 agonists. J Immunol. 2008;180:7604–7612. - PubMed

Publication types

MeSH terms