

Review
Regulation and functional correlates of slow wave sleep
Affiliations
- PMID: 19998869
- PMCID: PMC2824213
Item in Clipboard
Review
Regulation and functional correlates of slow wave sleep
J Clin Sleep Med.
.
No abstract available
Figures
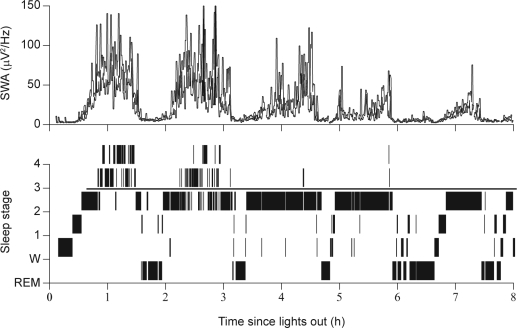
Slow wave sleep and slow wave activity (SWA) during nocturnal sleep in a healthy 22-year-old male subject (Dijk, unpublished data). REM, rapid eye movement.
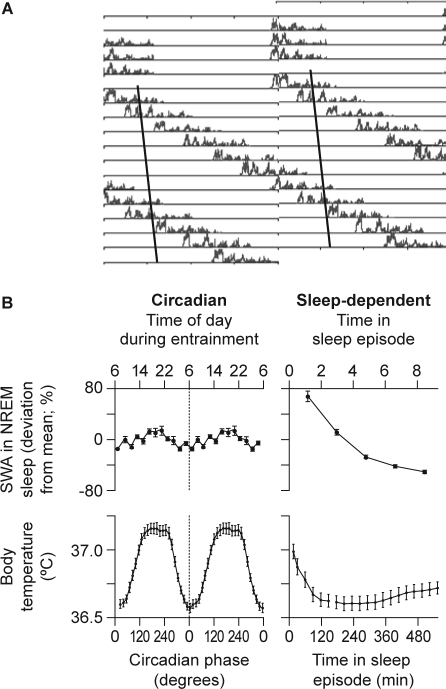
A: Time course of slow wave activity (SWA) during sleep episodes from a healthy subject during a forced desynchrony protocol. Data are double plotted, i.e., two consecutive 24-hour periods are plotted next to each other and below each other. The solid line represents the progression of the timing of the nadir of the core body temperature rhythm. Note that SWA declines in all sleep episodes, regardless of when the sleep episodes are initiated relative to the core body temperature nadir. B: Estimation of the circadian (left panel) and sleep-dependent (right panel) changes in SWA (upper panel) and core body temperature (lower panel) in 8 healthy subjects living in an environment free from time cues for 33–36 days and scheduled to a 28-hour rest–activity cycle. Note that while there is a robust sleep-dependent modulation of SWA, its circadian amplitude is very small, indicating that the SWA is not strongly modulated by circadian phase. NREM, nonrapid eye movement. Reproduced, with permission, from Dijk and Czeisler.
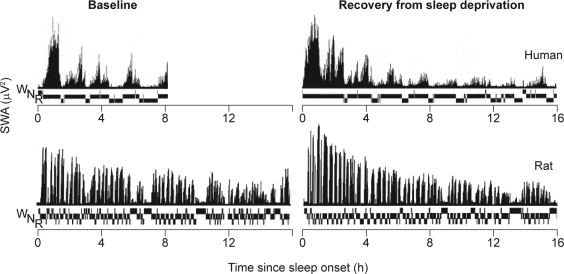
Time course of slow wave activity (SWA) and prevailing vigilance state (N, nonrapid eye movement sleep; R, rapid eye movement sleep; W, waking) during baseline sleep and recovery sleep following 36 hours' sleep deprivation in humans and 24 hours' sleep deprivation in the rat (Franken, unpublished data). Reproduced, with permission, from Dijk et al and Paul Franken.
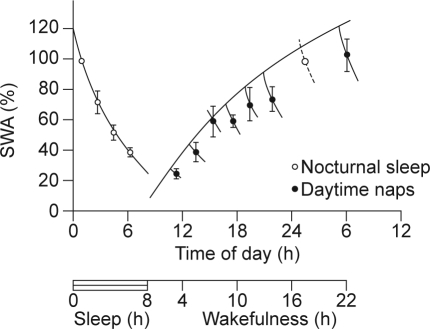
Slow wave activity (SWA) in nonrapid eye movement (NREM) sleep during baseline sleep and in the first NREM sleep (open circles) and in the first NREM sleep episodes of naps (closed circles) starting at 10, 12, 14, 16, 18, 20, and 22 hours in seven healthy female subjects. Data are plotted at the midpoint of NREM–REM cycles. Note that the first value of baseline sleep is replotted at 24 hours. Vertical lines indicate the standard error of the mean. A saturating exponential function was fitted through the extrapolated values at sleep onset. This extrapolation was based on the duration of the NREM–REM cycle of the naps and the time constant of the exponential declining function fitted through the average values of SWA in NREM–REM cycles of baseline sleep. All values are expressed as percentages of the value of slow wave activity in the first NREM–REM cycle of baseline night sleep. Reproduced, with permission, from Dijk.
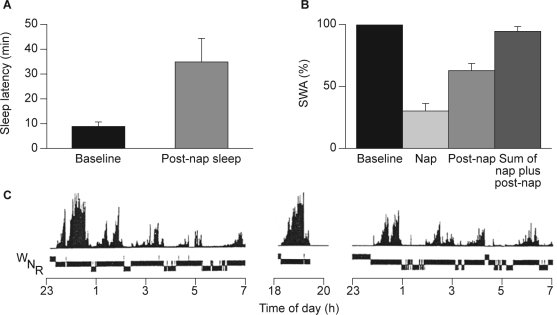
A: Sleep propensity, B: slow wave activity (SWA) and C: time course of SWA and vigilance states (N, nonrapid eye movement sleep; R, rapid eye movement sleep; W, waking) of baseline night, nap and post-nap sleep after a nap in the early evening in a single subject. SWA was expressed as a percentage of total accumulated SWA in baseline sleep. Reproduced, with permission, from Werth et al.
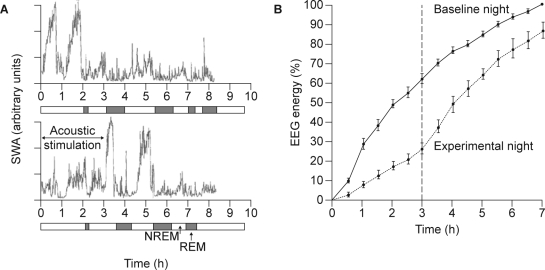
Effect of repeated disruption of sleep on slow wave activity (SWA) in nine healthy subjects. A: Time course of SWA during baseline sleep (top) and during a sleep episode during which SWA was suppressed by acoustic stimulation (bottom). B: Accumulation of electroencephalogram (EEG) energy during baseline (solid line) and a sleep episode during which SWA was suppressed by acoustic stimulation (dotted line). Solid vertical lines indicate the standard errors of the means. Dashed vertical line indicates the end of slow wave sleep deprivation during the experimental night. Values are expressed as a % of energy accumulated during the first 7 hours of the baseline night. NREM, nonrapid eye movement; REM, rapid eye movement. Reproduced, with permission, from Dijk and Dijk et al.
Similar articles
-
"White paper" on sleep and aging.J Am Geriatr Soc. 1982 Jan;30(1):25-50. doi: 10.1111/j.1532-5415.1982.tb03700.x. J Am Geriatr Soc. 1982. PMID: 7035529 Review. No abstract available.
-
Sleep and aging.Sleep. 1980;3(2):1-220. Sleep. 1980. PMID: 7010506 Review. No abstract available.
-
Hypnotics and sleep physiology: a consensus report. European Sleep Research Society, Committee on Hypnotics and Sleep Physiology.Eur Arch Psychiatry Clin Neurosci. 1991;241(1):13-21. doi: 10.1007/BF02193749. Eur Arch Psychiatry Clin Neurosci. 1991. PMID: 1679666 Review.
-
Napping predicts responsiveness to hypnotics in patients with primary circadian rhythm disorder.Psychiatry Clin Neurosci. 2002 Jun;56(3):231-2. doi: 10.1046/j.1440-1819.2002.00987.x. Psychiatry Clin Neurosci. 2002. PMID: 12047571
-
Dynamics of slow-wave activity and spindle frequency activity in the human sleep EEG: effect of midazolam and zopiclone.Neuropsychopharmacology. 1994 Dec;11(4):237-44. doi: 10.1038/sj.npp.1380110. Neuropsychopharmacology. 1994. PMID: 7857498 Clinical Trial.
Cited by
-
EEG Changes across Multiple Nights of Sleep Restriction and Recovery in Adolescents: The Need for Sleep Study.Sleep. 2016 Jun 1;39(6):1233-40. doi: 10.5665/sleep.5840. Sleep. 2016. PMID: 27091536 Free PMC article. Clinical Trial.
-
Sex differences in the circadian regulation of sleep and waking cognition in humans.Proc Natl Acad Sci U S A. 2016 May 10;113(19):E2730-9. doi: 10.1073/pnas.1521637113. Epub 2016 Apr 18. Proc Natl Acad Sci U S A. 2016. PMID: 27091961 Free PMC article.
-
Sleep Characteristics in Esport Players and Associations With Game Performance: Residual Dynamic Structural Equation Modeling.Front Sports Act Living. 2022 Jan 13;3:697535. doi: 10.3389/fspor.2021.697535. eCollection 2021. Front Sports Act Living. 2022. PMID: 35098116 Free PMC article.
-
Interactions between Sleep and Emotions in Humans and Animal Models.Medicina (Kaunas). 2022 Feb 11;58(2):274. doi: 10.3390/medicina58020274. Medicina (Kaunas). 2022. PMID: 35208598 Free PMC article. Review.
-
Racial disparities in sleep-related cardiac function in young, healthy adults: implications for cardiovascular-related health.Sleep. 2021 Nov 12;44(11):zsab164. doi: 10.1093/sleep/zsab164. Sleep. 2021. PMID: 34214173 Free PMC article.
References
-
- Bonnet MH. Sleep restoration as a function of periodic awakening, movement, or electroencephalographic change. Sleep. 1987;10:364–73. - PubMed
-
- Akerstedt T, Hume K, Minors D, Waterhouse J. Good sleep–its timing and physiological sleep characteristics. J Sleep Res. 1997;6:221–9. - PubMed
-
- Dijk DJ, Groeger J, Deacon S, Stanley N. Association between individual differences in slow wave sleep, slow wave activity and sleep continuity in young, middle-aged and older men and women. Eur Neuropsychopharmacol. 2006;16:S538.
-
- Ohayon MM, Carskadon MA, Guilleminault C, Vitiello MV. Meta-analysis of quantitative sleep parameters from childhood to old age in healthy individuals: developing normative sleep values across the human lifespan. Sleep. 2004;27:1255–73. - PubMed
-
- Rechtschaffen A, Kales A. A manual of standardized terminology, techniques and scoring system for sleep stages of human subjects. Washington, DC: Public Health Service, US Government Printing Office; 1968. - PubMed
Publication types
MeSH terms
Substances
Grants and funding
LinkOut - more resources
Full Text Sources
Other Literature Sources