An LC-IMS-MS platform providing increased dynamic range for high-throughput proteomic studies
- PMID: 20000344
- PMCID: PMC2819092
- DOI: 10.1021/pr900888b
An LC-IMS-MS platform providing increased dynamic range for high-throughput proteomic studies
Abstract
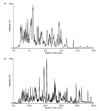
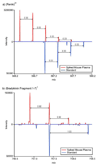
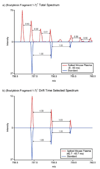
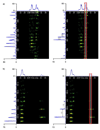
A high-throughput approach and platform using 15 min reversed-phase capillary liquid chromatography (RPLC) separations in conjunction with ion mobility spectrometry-mass spectrometry (IMS-MS) measurements was evaluated for the rapid analysis of complex proteomics samples. To test the separation quality of the short LC gradient, a sample was prepared by spiking 20 reference peptides at varying concentrations from 1 ng/mL to 10 microg/mL into a tryptic digest of mouse blood plasma and analyzed with both a LC-Linear Ion Trap Fourier Transform (FT) MS and LC-IMS-TOF MS. The LC-FT MS detected 13 out of the 20 spiked peptides that had concentrations >or=100 ng/mL. In contrast, the drift time selected mass spectra from the LC-IMS-TOF MS analyses yielded identifications for 19 of the 20 peptides with all spiking levels present. The greater dynamic range of the LC-IMS-TOF MS system could be attributed to two factors. First, the LC-IMS-TOF MS system enabled drift time separation of the low concentration spiked peptides from the high concentration mouse peptide matrix components, reducing signal interference and background, and allowing species to be resolved that would otherwise be obscured by other components. Second, the automatic gain control (AGC) in the linear ion trap of the hybrid FT MS instrument limits the number of ions that are accumulated to reduce space charge effects and achieve high measurement accuracy, but in turn limits the achievable dynamic range compared to the IMS-TOF instrument.
Figures


References
-
- Aebersold R, Mann M. Mass spectrometry-based proteomics. Nature. 2003;422:198–207. - PubMed
-
- Drabik A, Bierczynska-Krzysik A, Bodzon-Kulakowska A, Suder P, Kotlinska J, Silberring J. Proteomics in neurosciences. Mass Spectrom. Rev. 2007;26:432–450. - PubMed
-
- Andersen JS, Wilkinson CJ, Mayor T, Mortensen P, Nigg EA, Mann M. Proteomic characterization of the human centrosome by protein correlation profiling. Nature. 2003;426:570–577. - PubMed
-
- Jacobs JM, Mottaz HM, Yu LR, Anderson DJ, Moore RJ, Chen WNU, Auberry KJ, Strittmatter EF, Monroe ME, Thrall BD, Camp DG, Smith RD. Multidimensional proteome analysis of human mammary epithelial cells. J. Proteome Res. 2004;3:68–75. - PubMed
-
- Conrods TP, Zhou M, Petricoin EF, Liotta L, Veenstra TD. Cancer diagnosis using proteomic patterns. Expert Rev. Mol. Diagn. 2003;3:411–420. - PubMed
Publication types
MeSH terms
Substances
Grants and funding
LinkOut - more resources
Full Text Sources
Other Literature Sources

