

Factors that influence helical preferences for singly charged gas-phase peptide ions: the effects of multiple potential charge-carrying sites
- PMID: 20000372
- PMCID: PMC2818683
- DOI: 10.1021/jp9105103
Factors that influence helical preferences for singly charged gas-phase peptide ions: the effects of multiple potential charge-carrying sites
Abstract
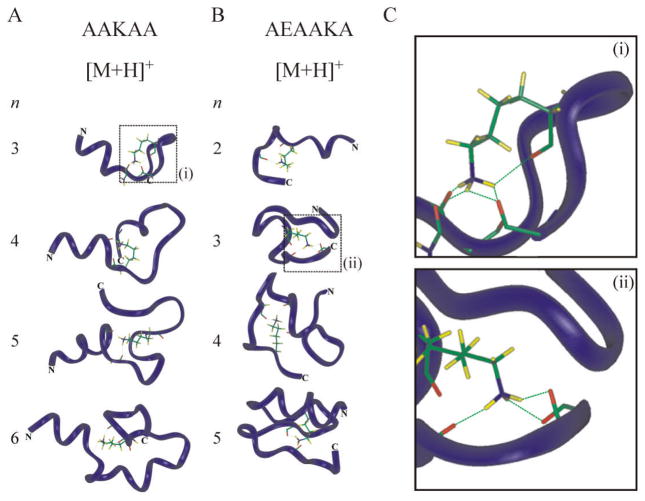
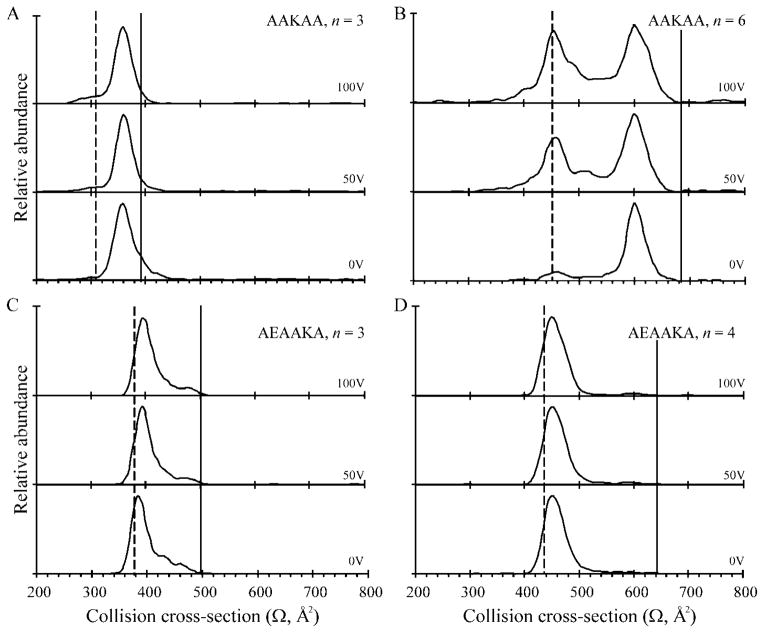
Ion mobility-mass spectrometry is used to investigate the structure(s) of a series of model peptide [M + H](+) ions to better understand how intrinsic properties affect structure in low dielectric environments. The influence of peptide length, amino acid sequence, and composition on gas-phase structure is examined for a series of model peptides that have been previously studied in solution. Collision cross sections for the [M + H](+) ions of Ac-(AAKAA)(n)Y-NH(2) (n = 3-6) and Ac-Y(AEAAKA)(n)F-NH(2) (n = 2-5) are reported and correlated with candidate structures generated using molecular modeling techniques. The [M + H](+) ions of the AAKAA peptide series each exhibit a single, dominant ion mobility arrival time distribution (ATD) which correlates to partial helical structures, whereas the [M + H](+) ions of the AEAAKA ion series are composed of ATDs which correlate to charge-solvated globules (i.e., the charge is coordinated or solvated by polar peptide functional groups). These data raise numerous questions concerning intrinsic properties (amino acid sequence and composition as well as charge location) that dictate gas-phase peptide ion structure, which may reflect trends for peptide ion structure in low dielectric environments, such as transmembrane segments.
Figures


Similar articles
-
The contributions of molecular framework to IMS collision cross-sections of gas-phase peptide ions.J Am Soc Mass Spectrom. 2009 Sep;20(9):1593-602. doi: 10.1016/j.jasms.2009.04.018. Epub 2009 May 5. J Am Soc Mass Spectrom. 2009. PMID: 19477658
-
Effects of charge states, charge sites and side chain interactions on conformational preferences of a series of model peptide ions.Analyst. 2015 Oct 21;140(20):6933-44. doi: 10.1039/c5an00826c. Epub 2015 Jun 17. Analyst. 2015. PMID: 26081298
-
A collision cross-section database of singly-charged peptide ions.J Am Soc Mass Spectrom. 2007 Jul;18(7):1232-8. doi: 10.1016/j.jasms.2007.04.003. Epub 2007 Apr 15. J Am Soc Mass Spectrom. 2007. PMID: 17512751
-
Substituent effects on the gas-phase fragmentation reactions of sulfonium ion containing peptides.Rapid Commun Mass Spectrom. 2007;21(7):1230-8. doi: 10.1002/rcm.2959. Rapid Commun Mass Spectrom. 2007. PMID: 17330214
-
Generation and manipulation of sodium cationized peptides in the gas phase.J Am Soc Mass Spectrom. 2004 Apr;15(4):607-15. doi: 10.1016/j.jasms.2003.12.014. J Am Soc Mass Spectrom. 2004. PMID: 15047065
Cited by
-
The power of ion mobility-mass spectrometry for structural characterization and the study of conformational dynamics.Nat Chem. 2014 Apr;6(4):281-94. doi: 10.1038/nchem.1889. Nat Chem. 2014. PMID: 24651194 Review.
-
The contributions of molecular framework to IMS collision cross-sections of gas-phase peptide ions.J Am Soc Mass Spectrom. 2009 Sep;20(9):1593-602. doi: 10.1016/j.jasms.2009.04.018. Epub 2009 May 5. J Am Soc Mass Spectrom. 2009. PMID: 19477658
-
THE IMS PARADOX: A PERSPECTIVE ON STRUCTURAL ION MOBILITY-MASS SPECTROMETRY.Mass Spectrom Rev. 2021 May;40(3):280-305. doi: 10.1002/mas.21642. Epub 2020 Jul 1. Mass Spectrom Rev. 2021. PMID: 32608033 Free PMC article. Review.
-
Gas-phase ion isomer analysis reveals the mechanism of peptide sequence scrambling.Anal Chem. 2014 Mar 18;86(6):2917-24. doi: 10.1021/ac401578p. Epub 2013 Dec 17. Anal Chem. 2014. PMID: 24313304 Free PMC article.
-
Deep learning the collisional cross sections of the peptide universe from a million experimental values.Nat Commun. 2021 Feb 19;12(1):1185. doi: 10.1038/s41467-021-21352-8. Nat Commun. 2021. PMID: 33608539 Free PMC article.
References
Publication types
MeSH terms
Substances
Grants and funding
LinkOut - more resources
Full Text Sources
Other Literature Sources
Research Materials
