

Review
doi: 10.1021/cr900263j.
New strategies for fluorescent probe design in medical diagnostic imaging
Affiliations
- PMID: 20000749
- PMCID: PMC3241938
- DOI: 10.1021/cr900263j
Item in Clipboard
Review
New strategies for fluorescent probe design in medical diagnostic imaging
Chem Rev.
.
No abstract available
Figures
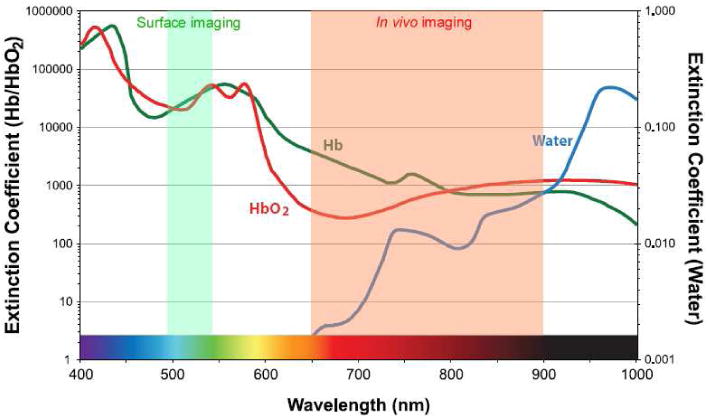
Extinction coefficient value of water, oxy- and deoxy-hemoglobin are plotted ranging from visible to near infrared wavelength.
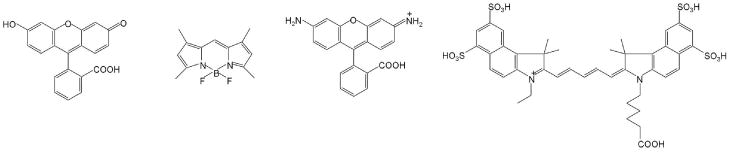
Small molecular fluorophores with representative cores including fluorescein-(fluorescein), BODIPY-(BODYPY-FL), rhodamine-(Rhodamine Green), cyanine-cores (Cy5.5).
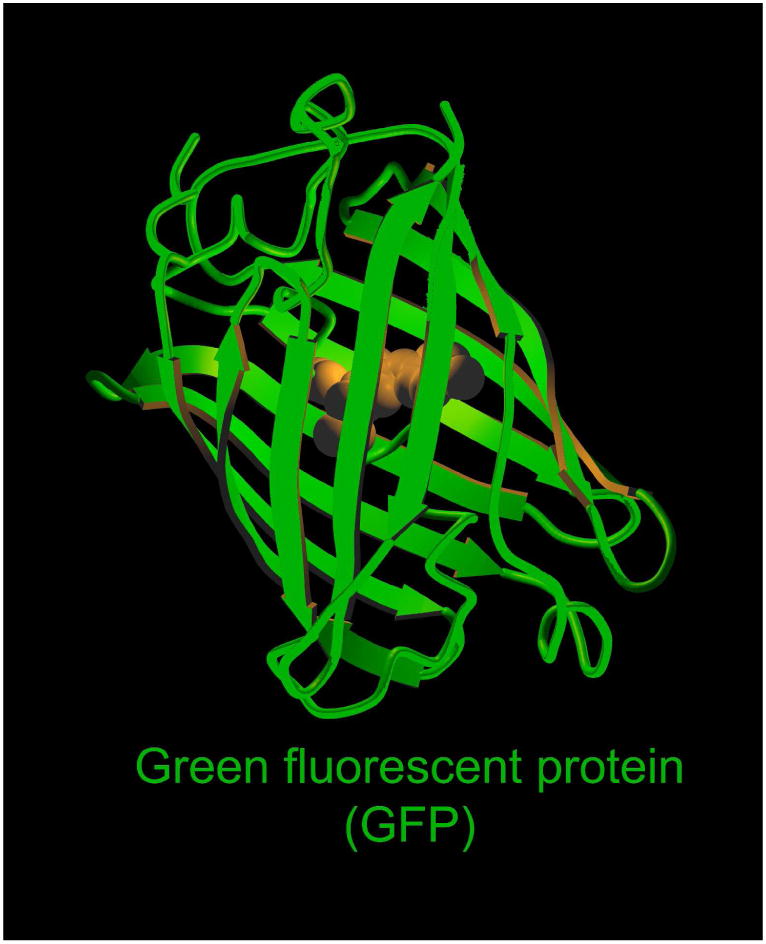
3D-structure of the green fluorescent protein.
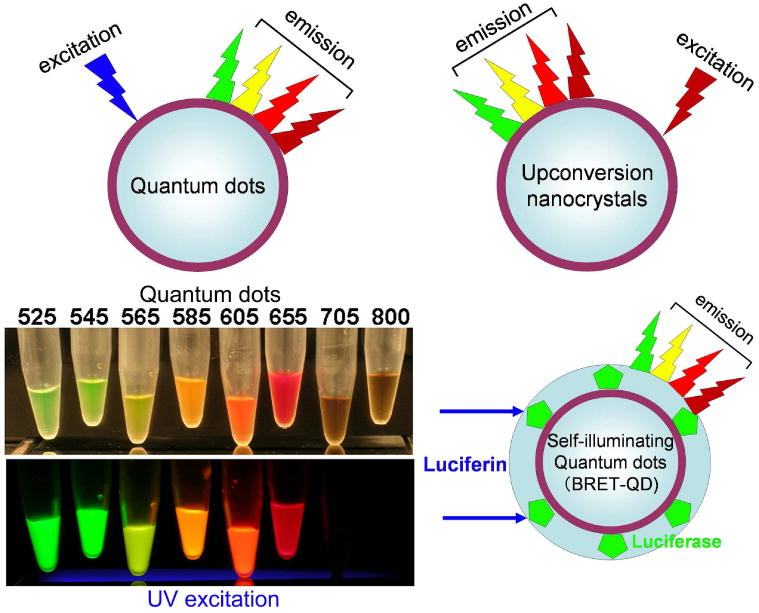
Schematic excitation and emission profiles of 3 nano-particles with heavy metal cores, which are currently employed for in vivo fluorescence imaging.
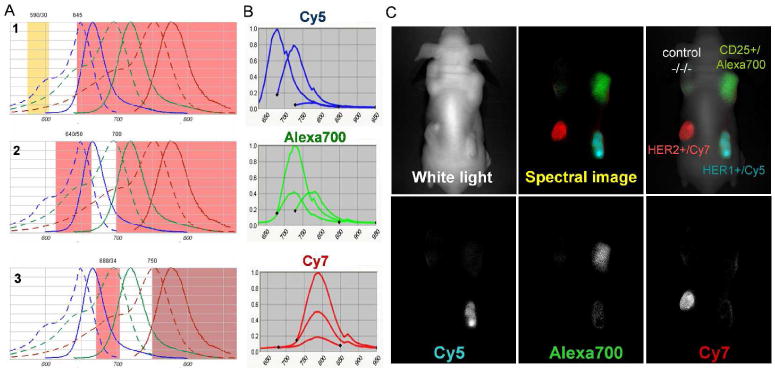
Multiple excitation multi-color spectral fluorescence imaging. A. Filter profiles, which were used for multiple excitation spectral fluorescence imaging with a combination of 3 near infrared fluorophores; Cy5, AlexaFlore700, and Cy7. B. Emission profiles of Cy5, AlexaFlore700, and Cy7 serially excited by 3 filter sets shown in A. C. An in vivo multiple excitation multi-color spectral fluorescence “in vivo immunohistochemistry” image of a mouse bearing 4 tumors; A431(HER1+), 3T3/HER2(HER2+), SP2/Tac(CD25+), and LS174T(a negative control). This image was taken 1 day after injection of 50ug cetuximab-Cy5 (anti-HER1), 50ug daclizumab-Alexa700 (anti-CD25), 50ug trastuzumab-Cy7 (anti-HER2) monoclonal antibody. Distinct antibodies were specifically accumulated in the respective tumors overexpressed with their specific antigens.
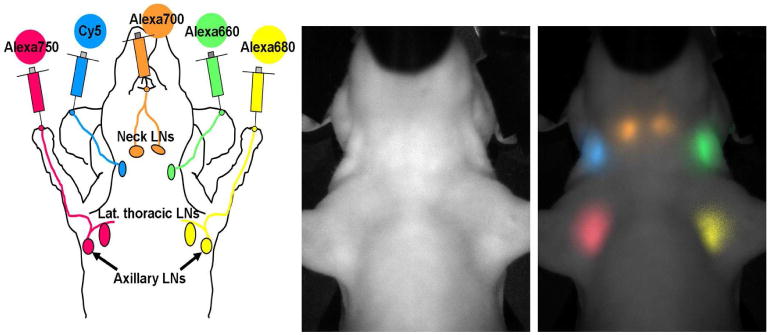
Simultaneous 5-color lympharic image in the head and neck region of a mouse injected with 5 different near infrared fluorophore-labeled half-coated generation-6 dendrimers is shown. A schema of injected sites and expected lymphatic drainage (left), a white light (left), and a 5-color spectrally resolved in vivo lymphatic drainage image (right) are shown.
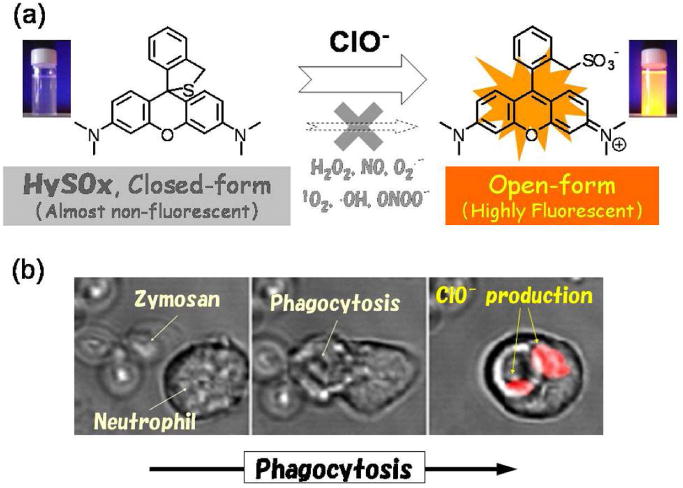
a. A schema of HySOx activation reacted with the hypochlorous acid. b. Serial images of cells, which produced hypochlorite, monitoring with HySOx in real-time.
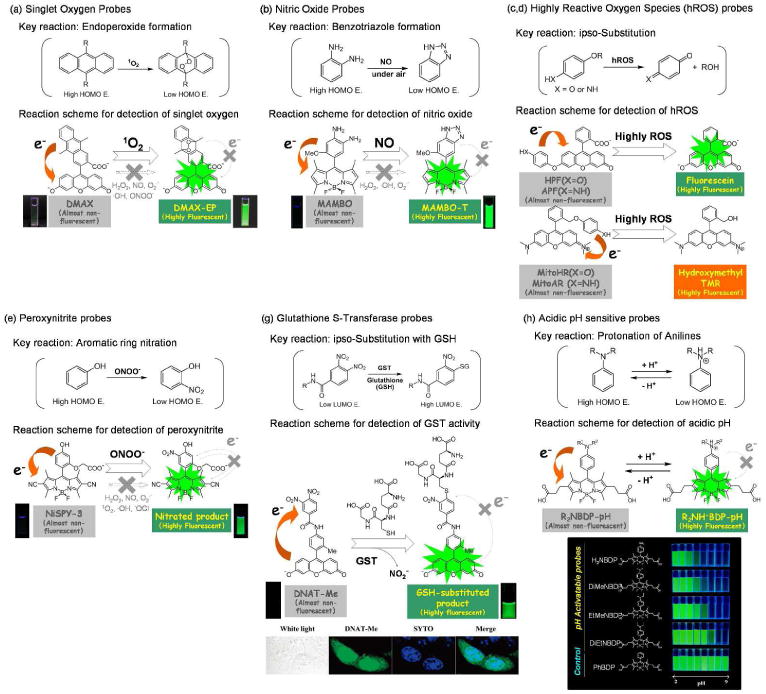
Schemas for the fluorescent signal activation of fluorescein-based activatable probes reacted with the singlet oxygen (a), nitric oxide (b), highly reactive oxygen species (hROS) (c, d), peroxynitrite (e), glutathione S-transferase (g), and acidic pH (h) based on the photon-induced electron transfer (PeT) theory.
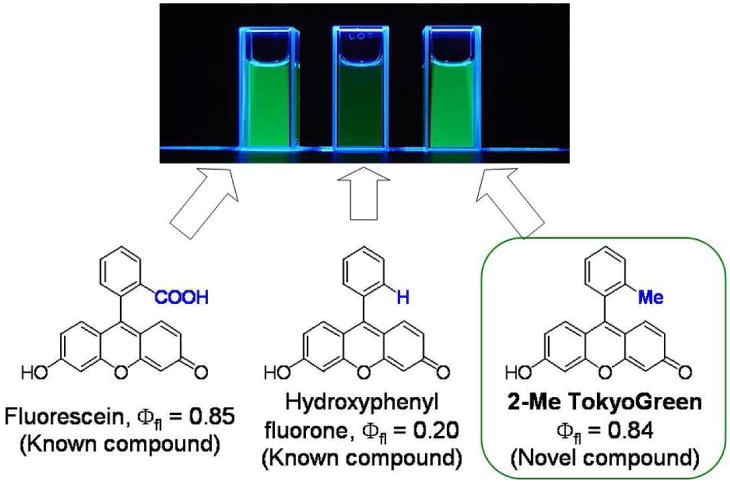
A schema of the development of Tokyo Green derived from fluorescein.
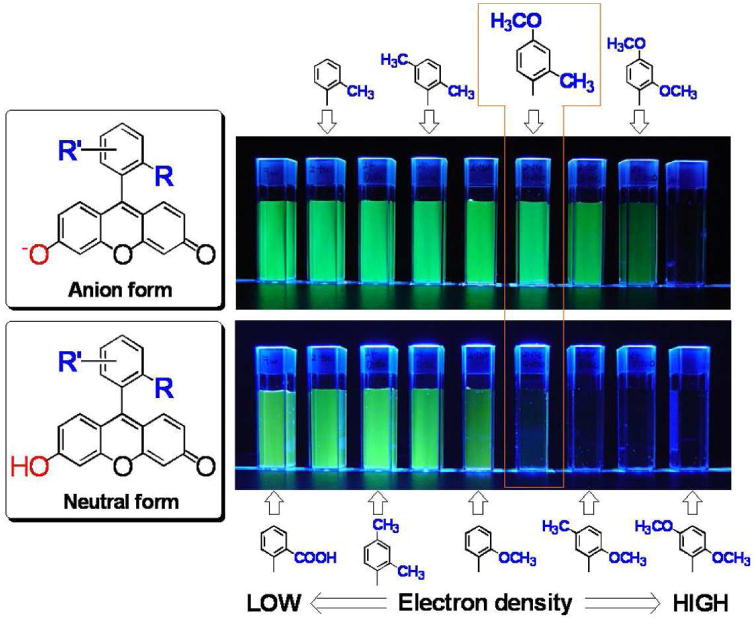
A schema of the photon-induced electron transfer (PeT) effects to the fluorescent signal of Tokyo Green-derivatives to demonstrate that 2-Me-4-OMe Tokyo Green can be a versatile scaffold for designing hydrolase probes
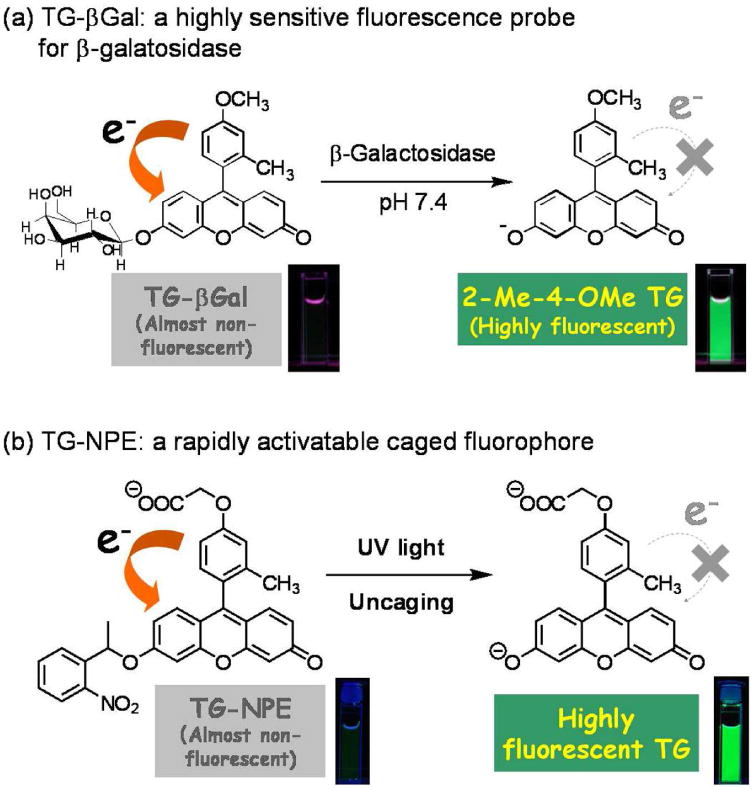
Schemas for the fluorescent signal activation of Tokyo Green-based activatable probes reacted with the β-galatosidase (a) and UV irradiation (caged) (b) probes
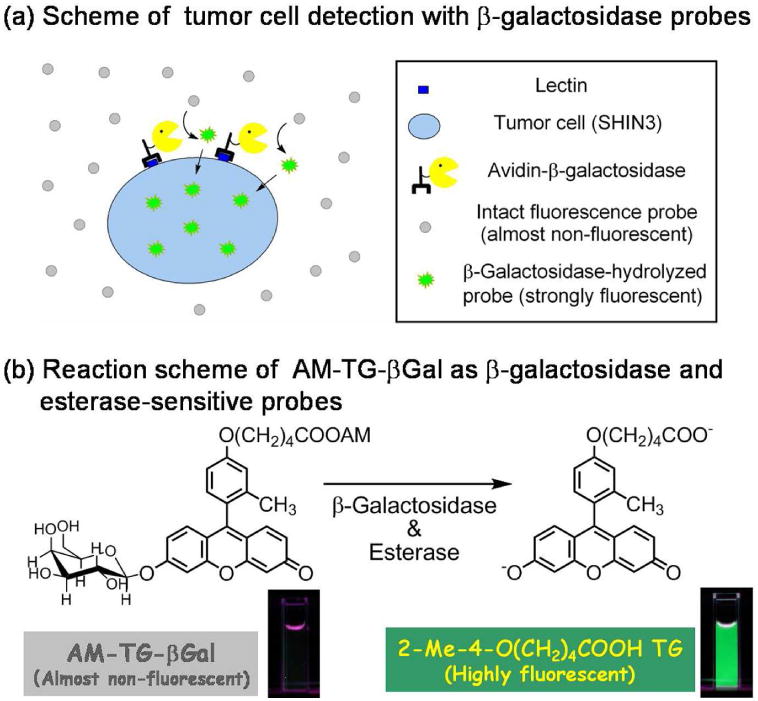
Delivery (a) and reaction (b) schemes of specific tumor cell detection with both esterase and β-galactosidase probes.
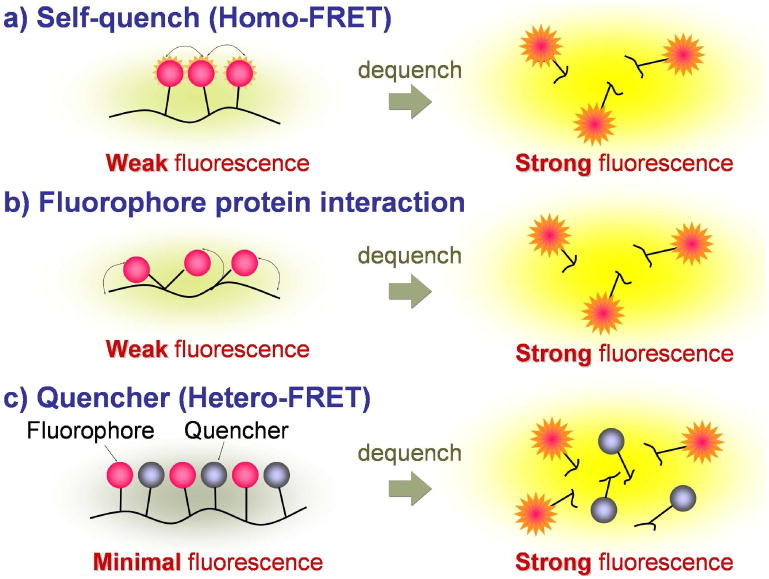
A schema for quenching/de-quenching (activation) of macromolecular probes conjugated with multiple fluorophore/quencher molecules.
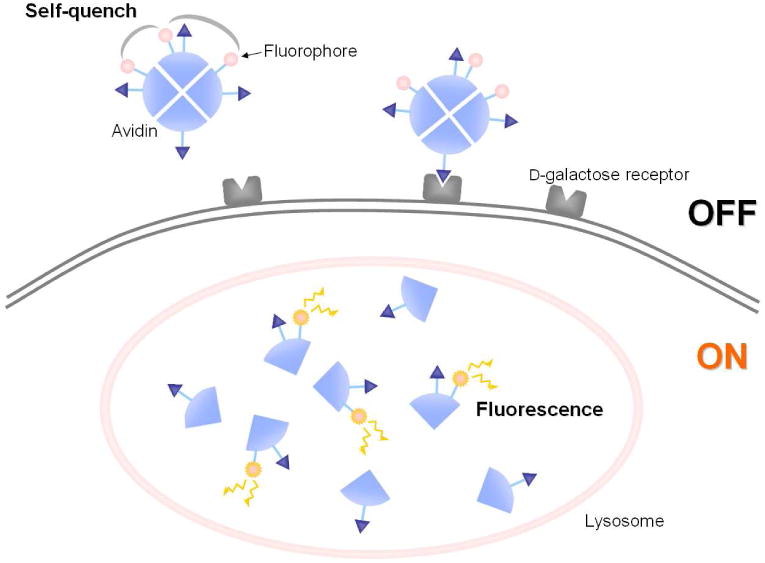
A schema for the activation mechanism of self-quenched avidin-3ROX probe targeting D-galactose receptor expressing cancer cells.
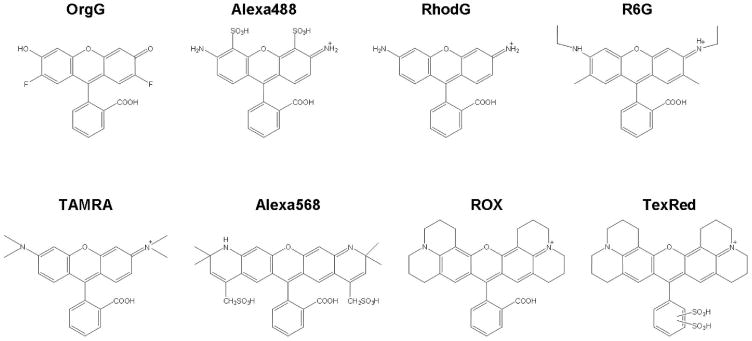
Chemical structures of xanthen-based fluorophores. Oregon Green (OrgG), Alexa Fluor488 (Alexa488), Rhodamine Green (RhodG), Rhodamine 6G (R6G), TAMRA, Alexa Fluor568 (Alexa568), ROX or Texas Red-X (TexRed)
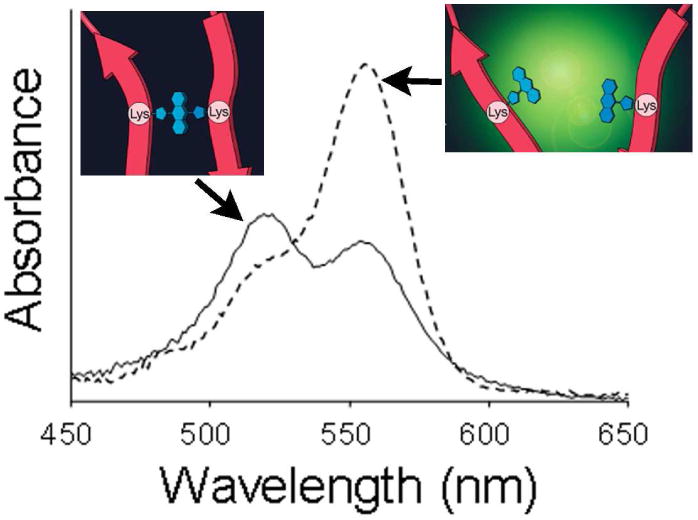
Absorbance spectrum of TAMRA conjugated avidin in PBS (solid line). The blue shifted peak (521 nm) represents the H-dimer formation of fluorophores. When the conjugate is treated with SDS to separate the fluorophores, the dimmer peak decreases and monomer peak (555 nm) increases.
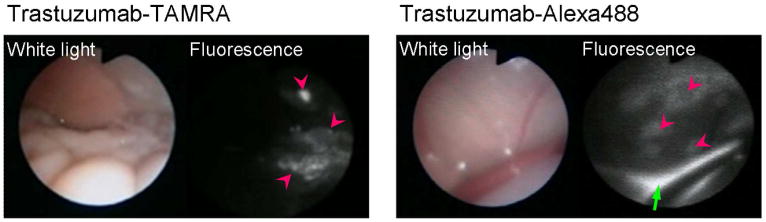
Fluorescence endoscopic images in peritoneal tumor bearing mice by avidin-TAMRA and avidin-Alexa488. The pink arrow heads show the tumor nodules. The tumors were clearly visualized with low background signal by the activatable probe, avidin-TAMRA. In contrast, the always-on probe, avidin-Alexa488 showed high background signal and high fluorescence from excess injectate in the peritoneal cavity (green arrow).
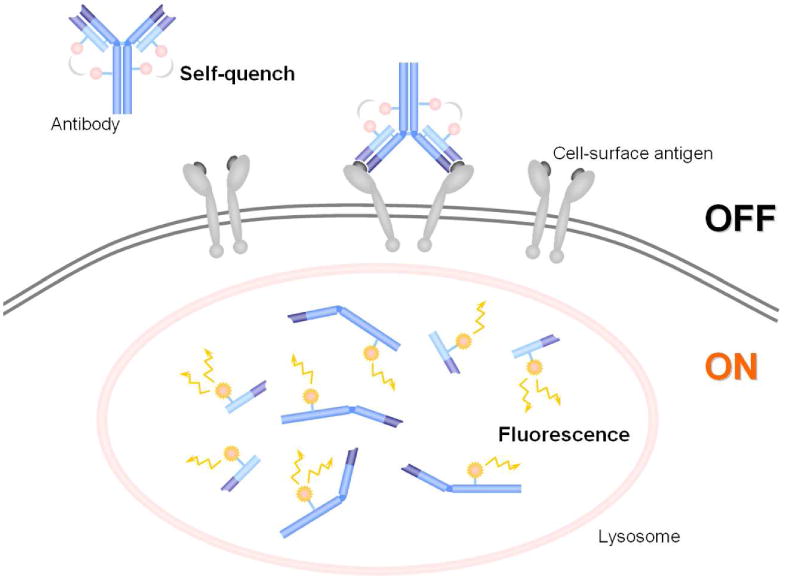
A schema for the concept of a self-quenching activation system with avidin-fluorophore or antibody-fluorophore conjugates. The fluorescence is self-quenched outside of the cell. When it binds to the target and is internalized, it is catabolized within the lysosome and dequenched. Thus, fluorescence is activated only inside the target cells.
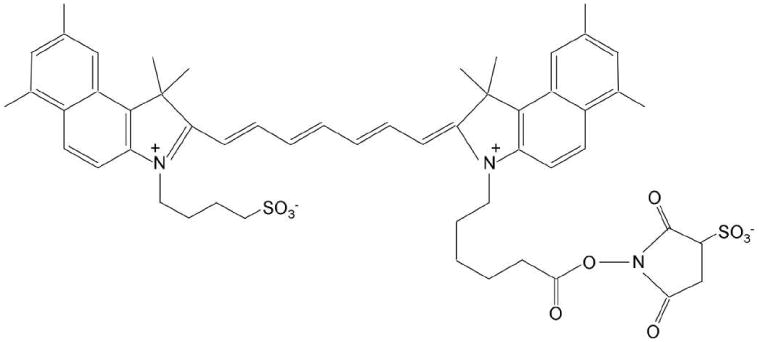
A chemical schema of the amine-reactive ingocyanine green probe.
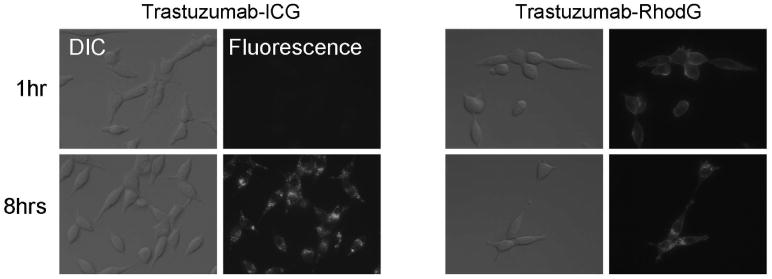
Fluorescence microscopy and differential interference contrast (DIC) images with 3T3/HER2 cells. For trastuzumab-ICG, the fluorescent signal was detected after internalization into the cells by 8hr incubation. The fluorescence signal was not detected by 1hr incubation while the conjugates were outside the cells binding to the surface receptors. In contrast, the always-ON fluorescence probe, trastuzumab-Rhodamine Green (RhodG) showed cell surface fluorescence by 1hr incubation. Many fluorescent dots were observed after the antibody internalization by 8hr incubation as well as the surface fluorescence.
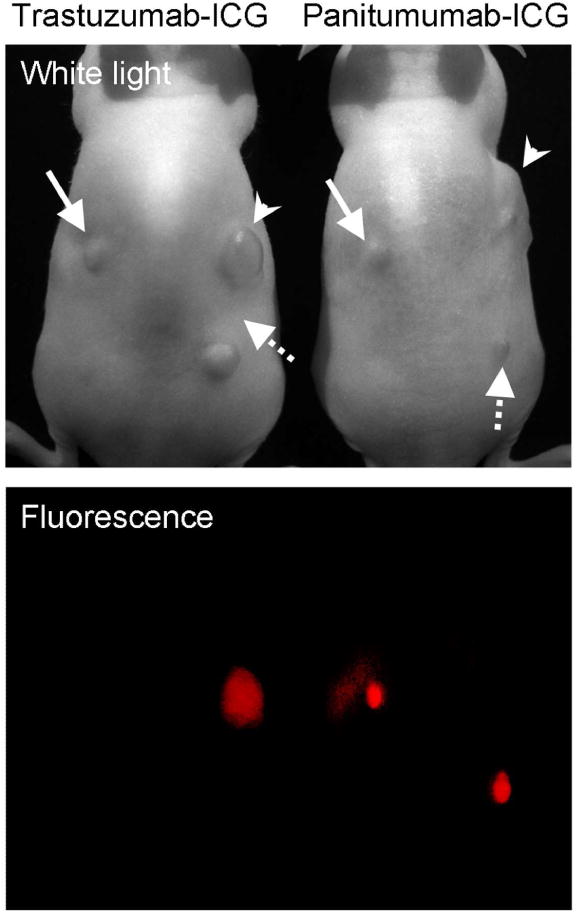
In vivo fluorescence images 4 days after the trastuzumab-ICG or panitumumab-ICG injection to the HER1 positive and HER2 positive tumor bearing mice. Arrow head; 3T3/HER2 tumors (HER2 positive), solid arrow; MDA-MB468 tumors (HER1 positive), dashed arrow; A431 (HER1 positive) tumors. Only the target specific tumor was detected by both conjugates.
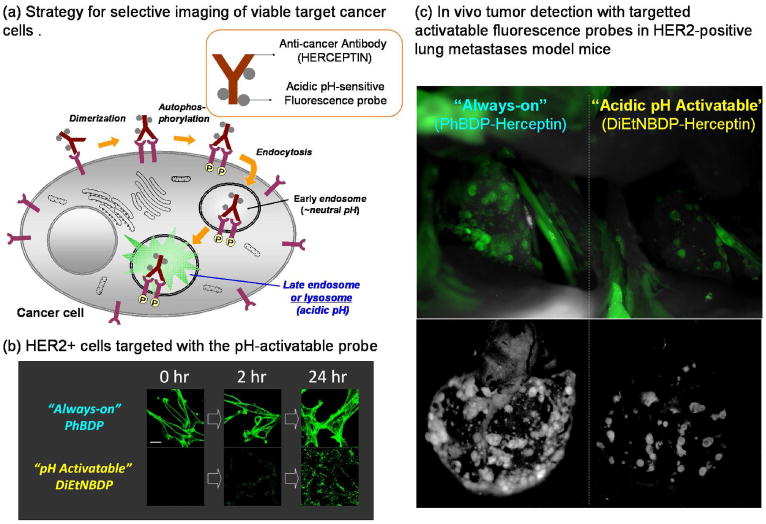
a. A schematic strategy for selective imaging of viable target cancer cells with acidic pH-sensitive small molecular probe conjugated with cell surface molecule targeted monoclonal antibodies. b. Confocal microscope images obtained just after the addition of the probes, and at 2, and 24 hours post-addition of “always on” and “pH-activatable” BDP-conjugated trastuzumab against HER2. c. In vivo tumor detection with targeted activatable fluorescence probes in HER2-positive lung metastases model mice. The pH-activatable probe produces a fluorescence signal only from tumors in the lung. However, the control “always on” probe produces a fluorescence signal not only from tumors, but also from the background normal lung and heart.
References
Publication types
MeSH terms
Substances
Grants and funding
LinkOut - more resources
Full Text Sources
Other Literature Sources
Medical
