. 2009 Dec;24(12):1969-80.
doi: 10.1359/jbmr.090525.

Interindividual variation in functionally adapted trait sets is established during postnatal growth and predictable based on bone robustness

Affiliations

Interindividual variation in functionally adapted trait sets is established during postnatal growth and predictable based on bone robustness

Nirnimesh Pandey et al. J Bone Miner Res. 2009 Dec.

Abstract

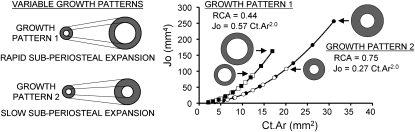
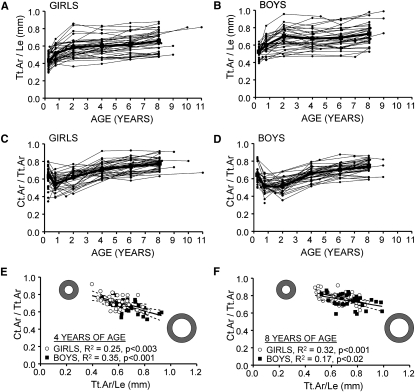
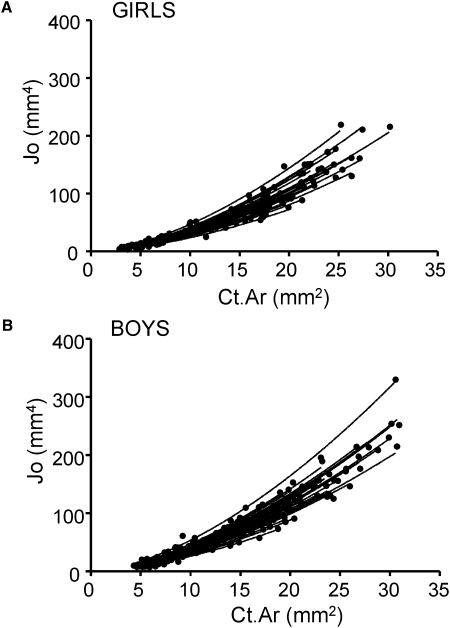
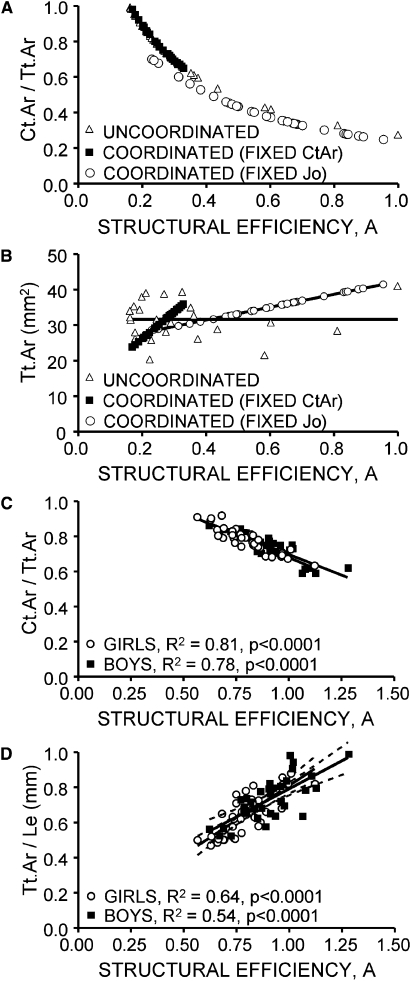
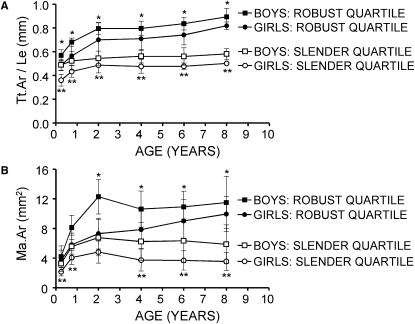
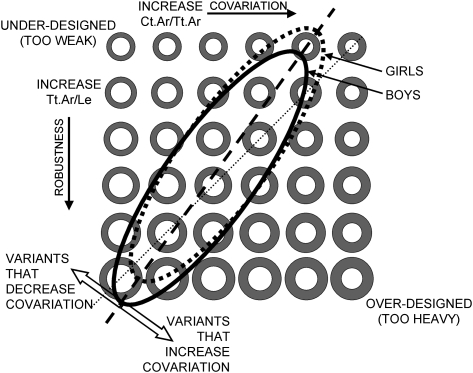
Adults acquire unique sets of morphological and tissue-quality bone traits that are predictable based on robustness and deterministic of strength and fragility. How and when individual trait sets arise during growth has not been established. Longitudinal structural changes of the metacarpal diaphysis were measured for boys and girls from 3 mo to 8 yr of age using hand radiographs obtained from the Bolton-Brush collection. Robustness varied approximately 2-fold among boys and girls, and individual values were established by 2 yr of age, indicating that genetic and environmental factors controlling the relationship between growth in width and growth in length were established early during postnatal growth. Significant negative correlations between robustness and relative cortical area and a significant positive correlation between robustness and a novel measure capturing the efficiency of growth indicated that coordination of the subperiosteal and endocortical surfaces was responsible for this population acquiring a narrow range of trait sets that was predictable based on robustness. Boys and girls with robust diaphyses had proportionally thinner cortices to minimize mass, whereas children with slender diaphyses had proportionally thicker cortices to maximize stiffness. Girls had more slender metacarpals with proportionally thicker cortices compared with boys at all prepubertal ages. Although postnatal growth patterns varied in fundamentally different ways with sex and robustness, the dependence of trait sets on robustness indicated that children sustained variants affecting subperiosteal growth because they shared a common biological factor regulating functional adaptation. Considering the natural variation in acquired trait sets may help identify determinants of fracture risk, because age-related bone loss and gain will affect slender and robust structures differently.


Figures

FIG. 1
FIG. 1
Variation in subperiosteal expansion relative to endocortical expansion leads to differences in the relationship between polar moment of inertia, Jo, and cortical area, Ct.Ar. Idealized cylindrical structures growing with the same relative expansion rates of the outer and inner surfaces (i.e., same relative cortical area, RCA = Ct.Ar/Tt.Ar) show identical Jo vs. Ct.Ar curves, regardless of the rate of external growth or the adult size. Growth patterns that differ in RCA follow different Jo vs. Ct.Ar curves. The relationship between Jo and Ct.Ar can be modeled as a power-law regression (y = AxB), where the constant, A, becomes a measure of the structural efficiency of growth when the exponent, B, is held fixed.
FIG. 2
FIG. 2
Robustness (Tt.Ar/Le) of the second metacarpal diaphysis varied widely among (A) girls and (B) boys and was established largely by 2 yr of age. Variation in RCA (Ct.Ar/Tt.Ar) of the second metacarpal diaphysis as a function of age for (B) girls and (C) boys. Ct.Ar/Tt.Ar correlated negatively with robustness (Tt.Ar/Le) at nearly all ages including (D) 4 and (E) 8 yr of age. The 95% CIs for the regressions are shown as dashed lines.
FIG. 3
FIG. 3
Variable postnatal growth patterns from 3 mo to 8 yr of age lead to wide variation in the relationship between polar moment of inertia, Jo, and cortical area, Ct.Ar, measured at the midshaft of the second metacarpal for (A) girls and (B) boys.
FIG. 4
FIG. 4
(A) A computer model simulating growth of circular cylinders with the same length showed that RCA (Ct.Ar/Tt.Ar) decreased with the structural efficiency parameter, A, regardless of whether subperiosteal and endocortical surface movements were coordinated or uncoordinated. (B) The computer simulation also showed a strong positive correlation between the structural efficiency parameter, A, and bone size (Tt.Ar) measured at 8 yr of age only when the relative movements of the outer and inner surfaces were coordinated by constraining all cylinders to have the same age changes in cortical area, Ct.Ar, or polar moment of inertia, Jo. (C) The relative cortical area (RCA = Ct.Ar/Tt.Ar) of the second metacarpal diaphysis measured at 8 yr of age for boys and girls correlated negatively with the structural efficiency parameter, A, measured across growth from the Jo vs. Ct.Ar curves. (D) Robustness (Tt.Ar/Le) measured at 8 yr of age correlated positively with the structural efficiency parameter, A, for both boys and girls. The 95% CIs are shown as dashed lines.
FIG. 5
FIG. 5
(A) Robustness (Tt.Ar/Le) and (B) marrow area (Ma.Ar) of the second metacarpal diaphysis change over time differently for boys and girls in the most robust quartile compared with those in the most slender quartile. Quartiles were assessed using data at 8 yr of age. Error bars are SD. *p < 0.008 for boys and **p < 0.008 for girls (t-tests corrected for multiple comparisons).
FIG. 6
FIG. 6
Schematic showing the large number of trait sets that could be exhibited by a genetically heterogeneous population at a single age. The different combinations of total area, Tt.Ar, and marrow area, Ma.Ar, shown vary according to robustness (y-axis) and relative cortical area (x-axis). The study population showed a fairly narrow range of trait sets, which is shown by the overlapping ellipses for boys and girls.

Similar articles

Cited by

References

    1. Carpenter RD, Beaupre GS, Lang TF, Orwoll ES, Carter DR. New QCT analysis approach shows the importance of fall orientation on femoral neck strength. J Bone Miner Res. 2005;20:1533–1542. - PubMed
    1. Albright F, Smith PH, Richardson AM. Post-menopausal osteoporosis. Its clinical features. JAMA. 1941;116:2465–2474.
    1. Gilsanz V, Loro ML, Roe TF, Sayre J, Gilsanz R, Schulz EE. Vertebral size in elderly women with osteoporosis. Mechanical implications and relationship to fractures. J Clin Invest. 1995;95:2332–2337. - PMC - PubMed
    1. Vega E, Ghiringhelli G, Mautalen C, Rey Valzacchi G, Scaglia H, Zylberstein C. Bone mineral density and bone size in men with primary osteoporosis and vertebral fractures. Calcif Tissue Int. 1998;62:465–469. - PubMed
    1. Duan Y, Turner CH, Kim BT, Seeman E. Sexual dimorphism in vertebral fragility is more the result of gender differences in age-related bone gain than bone loss. J Bone Miner Res. 2001;16:2267–2275. - PubMed

Publication types