. 2010 Mar;27(3):587-98.
doi: 10.1089/neu.2009.1063.

Diffusion tensor imaging at 3 hours after traumatic spinal cord injury predicts long-term locomotor recovery

Affiliations

Diffusion tensor imaging at 3 hours after traumatic spinal cord injury predicts long-term locomotor recovery

Joong H Kim et al. J Neurotrauma. 2010 Mar.

Abstract

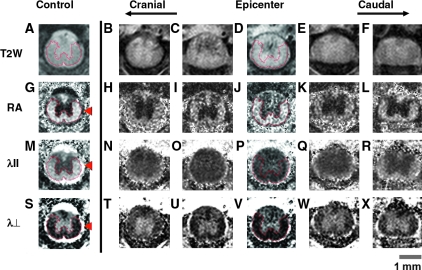
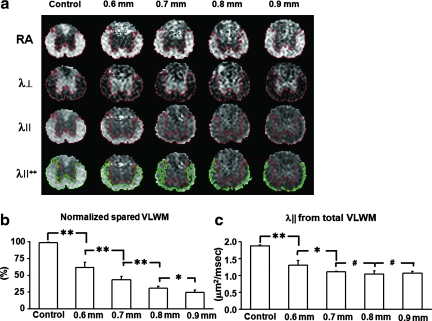
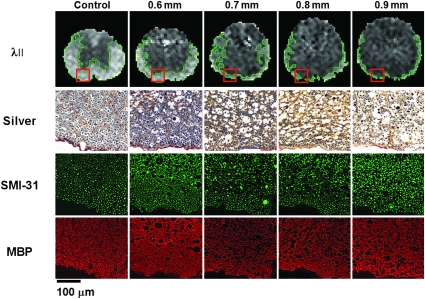
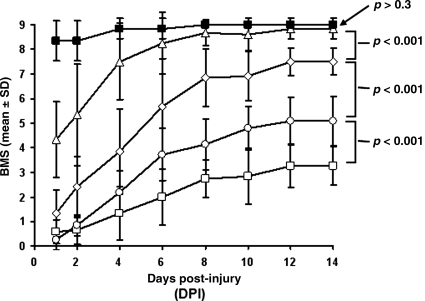
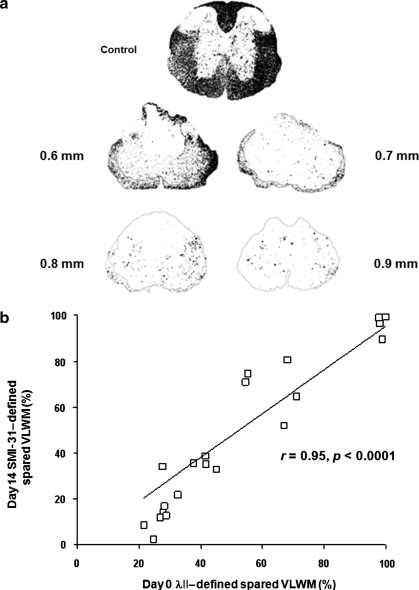
Accurate diagnosis of spinal cord injury (SCI) severity must be achieved before highly aggressive experimental therapies can be tested responsibly in the early phases after trauma. These studies demonstrate for the first time that axial diffusivity (lambda||), derived from diffusion tensor imaging (DTI) within 3 h after SCI, accurately predicts long-term locomotor behavioral recovery in mice. Female C57BL/6 mice underwent sham laminectomy or graded contusive spinal cord injuries at the T9 vertebral level (5 groups, n = 8 for each group). In-vivo DTI examinations were performed immediately after SCI. Longitudinal measurements of hindlimb locomotor recovery were obtained using the Basso mouse scale (BMS). Injured and spared regions of ventrolateral white matter (VLWM) were reliably separated in the hyperacute phase by threshold segmentation. Measurements of lambda|| were compared with histology in the hyperacute phase and 14 days after injury. The spared normal VLWM determined by hyperacute lambda|| and 14-day histology correlated well (r = 0.95). A strong correlation between hindlimb locomotor function recovery and lambda||-determined spared normal VLWM was also observed. The odds of significant locomotor recovery increased by 18% with each 1% increase in normal VLWM measured in the hyperacute phase (odds ratio = 1.18, p = 0.037). The capability of measuring subclinical changes in spinal cord physiology and murine genetic advantages offer an early window into the basic mechanisms of SCI that was not previously possible. Although significant obstacles must still be overcome to derive similar data in human patients, the path to clinical translation is foreseeable and achievable.


Figures

FIG. 1.
FIG. 1.
Hyperacute, 3 h after insult, in-vivo diffusion tensor imaging (DTI) maps of sham control (left column) and 0.9-mm contusion spinal cord injury (SCI; columns 2–6) animals. All images had 750-μm thickness extending rostral and caudal to the epicenter. Standard T2-weighted (T2W) images (top row) demonstrate extensive edema obscuring the gray-white matter junction, and small punctuate foci of hemorrhage (dark signal) within the central gray matter. Relative anisotropy (RA) maps (scale 0–1.414) demonstrate excellent central gray matter (isotropic, dark signal) and peripheral white matter (anisotropic, bright signal) contrast in regions obscured by edema on standard T2W sequences (compare to top row). RA maps are essential for manual identification of ventrolateral white matter (VLWM) long tracts in the hyperacute phase after experimental SCI. The arrowhead indicates cerebrospinal fluid. Axial diffusion (λ||) represents the relative movement of protons parallel to the long axis of the spinal cord after the application of DTI gradients. Quantitative λ|| maps (scale 0–3 μm2/msec) demonstrate dark signal intensity within injured white matter long tracts. Decreases in λ|| indicate axonal injury. Radial diffusion (λ⊥ ) represents the relative movement of protons perpendicular to the long axis of the spinal cord. In the hyperacute phase after SCI, qualitative reductions in λ ⊥ (0–1 μm2/msec) are likely the result of cytotoxic edema. Color image is available online at www.libertonline.com/neu.
FIG. 2.
FIG. 2.
Normal ventrolateral white matter (VLWM) λ|| histogram. Data graphically represent the normal range of VLWM λ|| values acquired from 6 sham control mice with manual segmentation (red outline). The total VLWM was manually delineated from RA and λ ⊥ maps and applied to λ|| maps. The distribution of each control mouse VLWM λ|| is shown with mean (solid squares) and standard deviation (open squares). The final histogram shown as a graph is a combination of each mouse's VLWM λ|| distribution. Automatic segmentation using threshold values did not differ significantly from regions segmented manually. λ||++ contains both total and spared VLWM regions of interest. This relatively simple method was used to identify spared normal VLWM non-invasively in vivo during the first 3 h post-SCI. Color image is available online at www.libertonline.com/neu.
FIG. 3.
FIG. 3.
Maps of λ|| demonstrate the decrease in spared ventrolateral white matter (VLWM) associated with greater injury severity. RA, λ⊥ , and λ|| maps are displayed in scales of 0–1.414, 0–1, and 0–3 μm2/msec, respectively. (a) Representative hyperacute in-vivo diffusion tensor imaging (DTI) maps of sham control animals and animals with all four SCI severities are shown. Injury grades are displayed as millimeters of dorsal spinal cord displacement. The classification of total VLWM was manually performed, and spared VLWM was performed though threshold segmentation based on normal values obtained from sham-operated VLWM animals. λ||++ contains both total (manual) and spared (threshold) VLWM regions of interest. (b) The spared VLWM obtained threshold segmentation is normalized with manually segmented total VLWM. Across all mice (n = 8 for all groups), the percentage of spared VLWM determined by threshold segmentation correlated with injury severity, and significantly differentiated all groups from one another (r = –0.97 and p < 0.0001). (c) Manual segmentation of total VLWM λ|| is not sufficient to detect significant differences between moderate and severe spinal cord injury grades in the hyperacute phase. Data in b and c are presented as mean and standard deviation (*p < 0.001; **p < 0.0001; #p > 0.1). Color image is available online at www.liebertonline.com/neu.
FIG. 4.
FIG. 4.
Sensitivity of in-vivo λ|| compared to histology for assessing hyperacute ventrolateral white matter (VLWM) integrity. Hyperacute λ|| maps are displayed with representative histological sections obtained from animals sacrificed immediately after diffusion tensor imaging (DTI) scans. Each column of histological sections is from the same animal. Outlines on the λ|| maps encompass image voxels displaying normal threshold values (mean ± 2 standard deviations) within regions of spared normal VLWM. Histological regions of interest are represented by boxes in the VLWM of each corresponding MR image. Silver staining and SMI-31 (neurofilament immunostaining) both depict progressively increasing axonal swelling and vacuolation indicative of cytotoxic edema as injury severity increases. Aside from the obvious morphological changes, no changes are evident in sections immunostained with myelin basic protein (MBP) over the range of injury grades (scale bar = 100 μm). Color image is available online at www.liebertonline.com/neu.
FIG. 5.
FIG. 5.
Basso mouse scale (BMS) scores from control (solid squares), 0.6- (triangles), 0.7- (diamonds), 0.8- (circles), and 0.9-mm-injured mice (open squares) obtained from 24 h to 14 days after spinal cord injury demonstrate corresponding degrees of hindlimb dysfunction. Data are presented as mean and standard deviation. At 24 h, no significant differences are seen between the 0.7-mm, 0.8-mm, and 0.9-mm injury groups (p > 0.1). All these animals essentially demonstrate hindlimb paralysis. Similarly to previous reports, the most rapid rates of recovery are seen during the acute phase (the first 7 days) after injury in all injury groups. In the early subacute phase (7–14 days), significant differences were demonstrated between all injury groups (p < 0.001). Animals receiving mild (0.6 mm) injuries were not significantly different from sham controls (p > 0.3).
FIG. 6.
FIG. 6.
In-vivo λ|| maps obtained 3 h after traumatic spinal cord injury (SCI) predict Basso mouse scale (BMS) locomotor scores at 14 days. (a) BMS scores are plotted against the percentage of spared normal ventrolateral white matter (VLWM) as measured with λ|| diffusion tensor imaging (DTI) scans in the hyperacute phase after injury in control (solid squares) animals, and those with 0.6- (triangles), 0.7- (diamonds), 0.8- (circles), and 0.9-mm displacement injury (open squares). A threshold value of 50% hyperacute spared VLWM optimally (but not completely) separated mice with complete (BMS = 9) versus incomplete (BMS <9) recovery. (b) Receiver operating characteristic (ROC) curve analysis (recovery defined as BMS = 9) revealed that hyperacute spared VLWM was highly predictive of day 14 BMS score. The odds of significant recovery increase by 18% with each 1% increase in normal VLWM demonstrated with λ|| in the first 3 h after SCI (odds ratio = 1.18; p = 0.037).
FIG. 7.
FIG. 7.
Correlation with hyperacute and chronic spared ventrolateral white matter (VLWM). (a) The number of phosphorylated neurofilament (SMI-31)-immunopositive axons 14 days after contusive spinal cord injury decreased with increasing injury severity. (b) In-vivo λ||-defined hyperacute spared VLWM was highly correlated with histological SMI-31-defined spared VLWM at 14 days post-injury.

Similar articles

Cited by

References

    1. Banik N.L. Matzelle D.C. Gantt-Wilford G. Osborne A. Hogan E.L. Increased calpain content and progressive degradation of neurofilament protein in spinal cord injury. Brain Res. 1997;752:301–306. - PubMed
    1. Basso D.M. Beattie M.S. Bresnahan J.C. Graded histological and locomotor outcomes after spinal cord contusion using the NYU weight-drop device versus transection. Exp. Neurol. 1996;139:244–256. - PubMed
    1. Basso D.M. Fisher L.C. Anderson A.J. Jakeman L.B. McTigue D.M. Popovich P.G. Basso Mouse Scale for locomotion detects differences in recovery after spinal cord injury in five common mouse strains. J. Neurotrauma. 2006;23:635–659. - PubMed
    1. Bilgen M. Abbe R. Narayana P.A. Dynamic contrast-enhanced MRI of experimental spinal cord injury: in vivo serial studies. Magn. Reson. Med. 2001;45:614–622. - PubMed
    1. Blight A.R. Macrophages and inflammatory damage in spinal cord injury. J. Neurotrauma. 1992;9(Suppl. 1):S83–S91. - PubMed

Publication types

MeSH terms