. 2010 Feb;16(2):629-41.
doi: 10.1089/ten.tea.2009.0458.

Three-dimensional culture alters primary cardiac cell phenotype

Affiliations

Three-dimensional culture alters primary cardiac cell phenotype

Robert E Akins Jr et al. Tissue Eng Part A. 2010 Feb.

Abstract

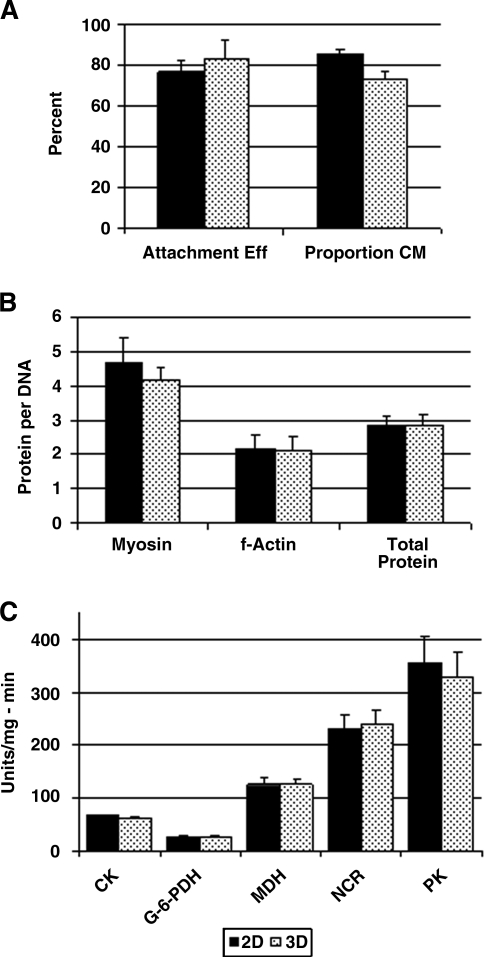
The directed formation of complex three-dimensional (3D) tissue architecture is a fundamental goal in tissue engineering and regenerative medicine. The growth of cells in 3D structures is expected to influence cellular phenotype and function, especially relative cell distribution, expression profiles, and responsiveness to exogenous signals; however, relatively few studies have been carried out to examine the effects of 3D reaggregation on cells from critical target organs, like the heart. Accordingly, we cultured primary cardiac ventricular cells in a 3D model system using a serum-free medium to test the hypothesis that expression profiles, multicellular organizational pathways, tissue maturation markers, and responsiveness to hormone stimulation were significantly altered in stable cell populations grown in 3D versus 2D culture. We found that distinct multi-cellular structures formed in 3D in conjunction with changes in mRNA expression profile, up-regulation of endothelial cell migratory pathways, decreases in the expression of fetal genes (Nppa and Ankrd1), and increased sensitivity to tri-iodothyronine stimulation when compared to parallel 2D cultures comprising the same cell populations. These results indicate that the culture of primary cardiac cells in 3D aggregates leads to physiologically relevant alterations in component cell phenotype consistent with cardiac ventricular tissue formation and maturation.


Figures

FIG. 1.
FIG. 1.
Assessment of homogeneity between two-dimensional (2D) and three-dimensional (3D) cultures. Samples were collected on day 1 or 6 of culture as indicated and assessed for bulk differences in culture composition, hypertrophy, and metabolic function. (A) Cell attachment efficiency was calculated as the number of cells attached to tissue culture polystyrene (TCPS) surfaces after 24 h divided by the total number of viable cells in the original inoculum. The proportion of attached cardiomyocytes (CMs), which are positive for myosin heavy chain (MyHC) immunostaining, per total adherent cells was also calculated. (B) On day 6, MyHC and filamentous actin (f-Actin) levels, which are indicative of CM hypertrophic status, were determined in fixed samples by fluorescence in situ quantitation assay and are presented as fluorescence ratios normalized to DNA. Total protein content, which is a key indicator of tissue hypertrophy, was measured in culture homogenates and normalized to DNA. Units presented are μg protein per 10 ng DNA. (C) Intermediary metabolic enzyme activities in day 6 cell extracts calculated as units of enzyme activity per mg of total protein per minute. No significant differences were found in (A), (B), or (C). Data are mean values ± standard deviation for n = 6 samples.
FIG. 2.
FIG. 2.
Cell proliferation in the serum-free medium. (A) Effects of serum on relative cell numbers were estimated by Cell Titer Blue (CTB) assays performed at intervals over 13 days of 2D culture. Cells grown in the serum-containing medium (◊) showed increasing CTB results, whereas cells grown in the serum-free medium (Δ) showed stable CTB levels over the same timeframe. Data are mean values ±standard deviation for n = 3 samples measured repeatedly over time. Serum-free and serum-containing time courses were found to be significantly different by repeated measures analysis of variance (p < 0.05). (B) BrdU incorporation over 6 h on day 4 of culture. Both the absence of serum and the culture at higher initial cell density resulted in decreased cell proliferative activity. Data presented are mean values ± standard deviation for n = 3 samples each assessed across 10 random microscope fields.
FIG. 3.
FIG. 3.
Distribution of cells in 3D aggregates. (A) Phase contrast image of a standard 2D culture on TCPS culture wells. Arrows indicate patches of elongated cells (lower arrow) indicative of cardiac muscle cells interspersed with nonmuscle cells (upper arrow). (B) Phase contrast image of 3D aggregates initiated on TCPS support beads. Arrow indicates typical 3D cell mass. Inset is a lower magnification view of a multi-cell/multi-bead aggregate. (C) Two-dimensional culture stained for MyHC to indicate CMs and DNA. Similar to (A), patches of cardiac muscle cells are interspersed with nonmuscle cells (arrows) in a mosaic pattern. (D) Three-dimensional culture stained for MyHC to indicate CMs and DNA. The exterior-most cells do not contain MyHC (arrows indicate nuclei of these cells). (E) Three-dimensional culture stained for vimentin and DNA, verifying the presence of mesenchymal/endothelial cells (ECs) on the aggregate surface (arrows); this staining is consistent with an EC layer. (F) Two-dimensional culture stained for platelet/endothelial cell adhesion molecule (PECAM) (CD31) and DNA showing an island of PECAM-positive ECs amidst PECAM-negative cells (arrow). (G) Three-dimensional culture stained for PECAM showing that exterior-most nuclei are within cells positive for PECAM (arrow), a marker for ECs in contact with each other. (H) Scanning electron micrograph (SEM) of a 2D culture. Lower arrow indicates an elongated, binucleate cell, which is consistent with a CM. Upper arrow indicates a mononucleated cell with a more spread morphology. Nuceoli are readily apparent. (I) SEM of a 3D culture surface showing only cells with an endothelial appearance are present (arrows). (J) SEM of the interior aspect of a rat heart lumen showing the configuration of the ECs lining the organ lumen. Bar = 50 μm except for inset figure in (B), where bar = 100 μm. Color images available online at www.liebertonline.com/ten.
FIG. 4.
FIG. 4.
Relative adhesion of muscle versus nonmuscle cells. The proportion of CMs to non-CMs in cultures that were plated for (A) 5 min, (B) 15 min, (C) 30 min, or overnight (inset in C) and then rinsed was tabulated based on the proportion of MyHC-positive CMs to total nuclei present after 24 h of culture. It is well established that non-myocytes adhere more rapidly than myocytes in serum-containing media, and here we show that the same phenomenon occurs in our serum-free system. (D) Graph showing the percent of MyHC-positive (CMs) and MyHC-negative cells (non-CMs) present on TCPS as a function of time. Squares indicate non-CMs present at the time indicated divided by the total non-CMs after 16 h; diamonds indicate CMs present at the given time to total CMs present after 16 h; triangles indicate the percent of adherent cells that were CMs. Under the conditions used, all of the non-CMs stuck in ∼45 min. In this timeframe, only about 10–15% of available CMs adhered; nevertheless, the cell population present at 45 min comprised about 30% CMs. Color images available online at www.liebertonline.com/ten.
FIG. 5.
FIG. 5.
Mediators of EC migration by real-time quantitative polymerase chain reaction. (A) Bmp-2 levels were substantially elevated in 3D on day 1 of culture and then attenuated on days 2 and 3 before peaking again on day 4. In 2D controls, there was a consistent rise in Bmp-2 until day 4 and then a decrease. (B) Id3, which mediates bone morphogenetic protein (BMP)-induced EC migration by inhibiting thrombospondin (Thbs), was also elevated on day 1 in 3D and then again on day 5. (C) Thbs1 remained low in 3D on day 1, as expected from the Id3 data, and then increased on day 2 and again on day 6. (D) Troponin I (Tnni3) expression, on the other hand, was evenly expressed in 3D and 2D cultures over time in as shown here by plotting actual Ct. (E) Three-dimensional masses formed along and between the TCPS beads used to initiate culture; these masses had a smooth surface of ECs (also see Fig. 3). (F) In cultures grown in the presence of 1 μg/mL Noggin, which inhibits receptor binding by BMP, cells grow on the TCPS bead surfaces but 3D masses do not form. Plotted data are mean values ± standard deviation for n = 3 determinations.
FIG. 6.
FIG. 6.
Cluster analysis of differentially expressed genes. Average normalized expression values across the two experiments are given on the Y-axis where normalized value = (raw value − mean value for 12 samples)/(standard deviation for 12 samples). The time course (days 1, 4, and 6) is presented for the 3D and 2D conditions. Probesets were grouped using K-Means Clustering with the number of clusters set at six based on figure of merit analysis. The expression patterns are shown for each of the six clusters on days 1, 4, and 6 from left to right under 3D and 2D conditions. The number of probesets included is given by n; error bars are standard deviations. Cluster members are given in Table 2.
FIG. 7.
FIG. 7.
Markers of ventricular maturation. (A) Immunoreactive atrial natriuretic peptide (ANP) levels determined by enzyme immunoassay assay. Data are presented as ng of total ANP (ANP plus pro-ANP plus pre-pro-ANP) per mg extracted protein. Three-dimensional cultures had substantially less ANP than parallel 2D cultures. Tissue levels are shown for reference. Data are means of duplicate determinations for each time point. (B) Representative Western blot of samples from 3D and 2D cultures collected at 1, 4, and 6 days after culture initiation showing substantial elevation in cardiac adriamycin response protein (CARP) levels in 2D culture.
FIG. 8.
FIG. 8.
Responsiveness to triiodothyronine (T3). (A) Representative ethidium-bromide-stained gel of multiplex polymerase chain reaction of reverse-transcribed RNA samples using combined primers for α- and β-MyHC. Atrial tissue, which contains α-MyHC but not β-MyHC, and soleus muscle, which contains β-MyHC but not α-MyHC, are shown as controls. (B) Quantification of α- to β-MyHC levels from (A) showing the higher level of sensitivity to physiologic doses of triiodothyronine in the 3D cultures.

Similar articles

Cited by

References

    1. Jakab K. Norotte C. Damon B. Marga F. Neagu A. Besch-Williford C.L. Kachurin A. Church K.H. Park H. Mironov V. Markwald R. Vunjak-Novakovic G. Forgacs G. Tissue engineering by self-assembly of cells printed into topologically defined structures. Tissue Eng Part A. 2008;14:413. - PubMed
    1. Yildirim Y. Naito H. Didie M. Karikkineth B.C. Biermann D. Eschenhagen T. Zimmermann W.H. Development of a biological ventricular assist device: preliminary data from a small animal model. Circulation. 2007;116:I16. - PubMed
    1. Masuda S. Shimizu T. Yamato M. Okano T. Cell sheet engineering for heart tissue repair. Adv Drug Deliv Rev. 2008;60:277. - PubMed
    1. Sekine H. Shimizu T. Hobo K. Sekiya S. Yang J. Yamato M. Kurosawa H. Kobayashi E. Okano T. Endothelial cell coculture within tissue-engineered cardiomyocyte sheets enhances neovascularization and improves cardiac function of ischemic hearts. Circulation. 2008;118:S145. - PubMed
    1. Akins R. Gratton K. Quezada E. Rutter H. Tsuda T. Soteropoulos P. Gene expression profile of bioreactor-cultured cardiac cells: activation of morphogenetic pathways for tissue engineering. DNA Cell Biol. 2007;26:425. - PubMed

Publication types

MeSH terms

LinkOut - more resources