. 2010 Jul;20(4):738-50.
doi: 10.1111/j.1750-3639.2009.00354.x. Epub 2009 Nov 5.

Chronic cortical and subcortical pathology with associated neurological deficits ensuing experimental herpes encephalitis

Affiliations

Chronic cortical and subcortical pathology with associated neurological deficits ensuing experimental herpes encephalitis

Anibal G Armien et al. Brain Pathol. 2010 Jul.

Abstract

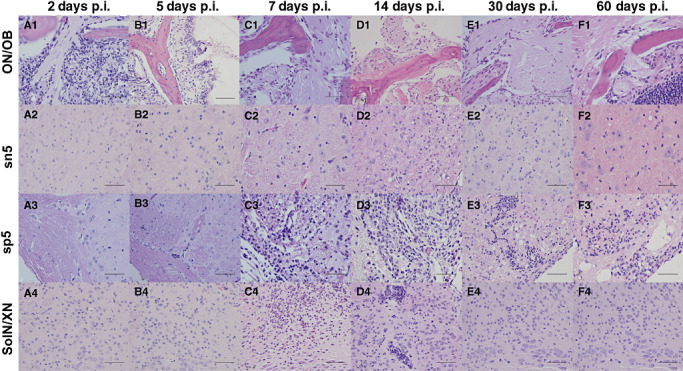
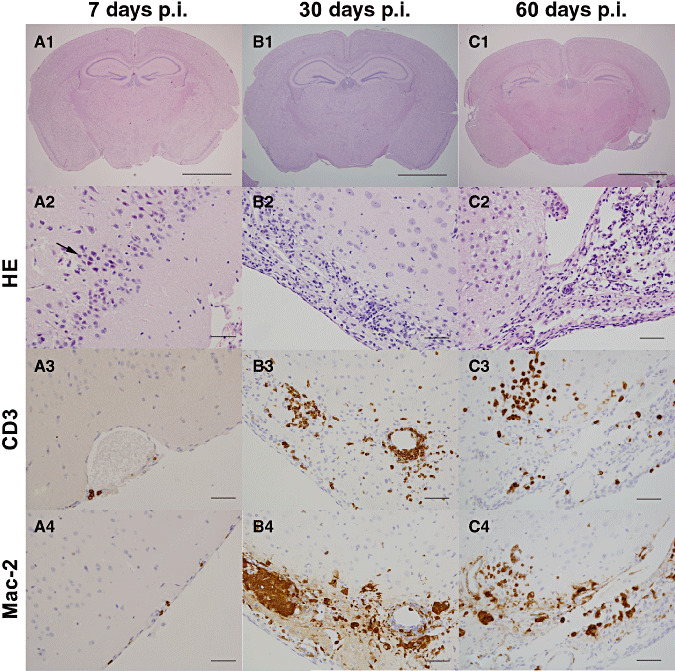
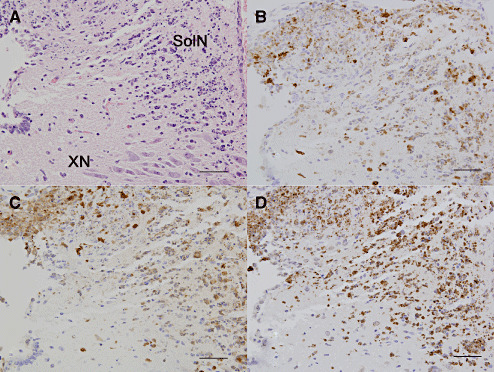
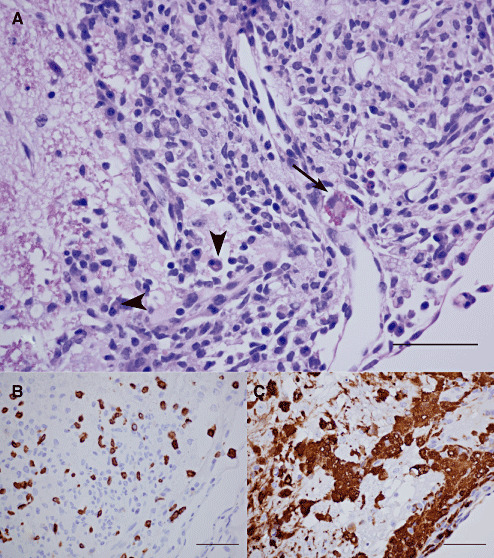
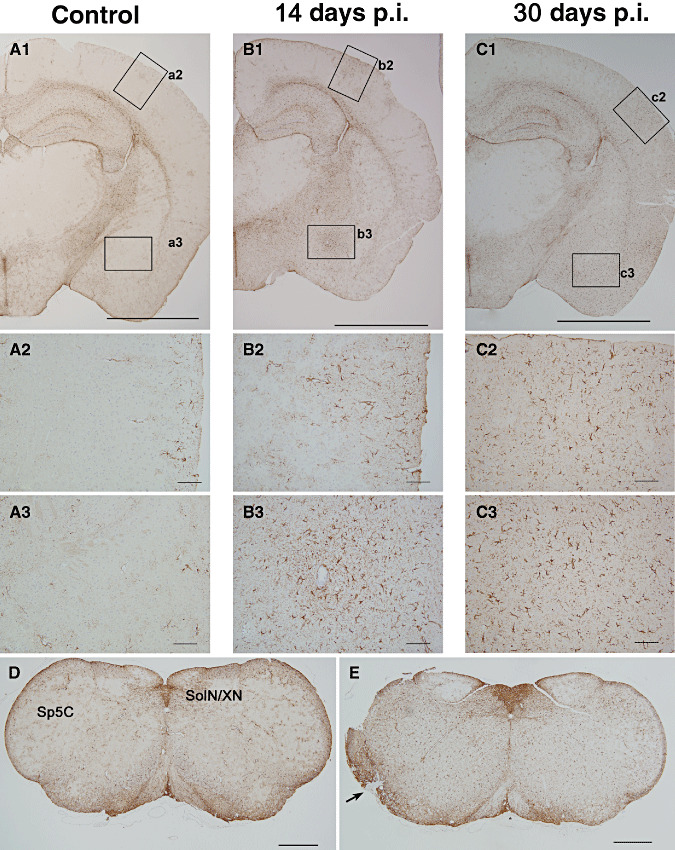
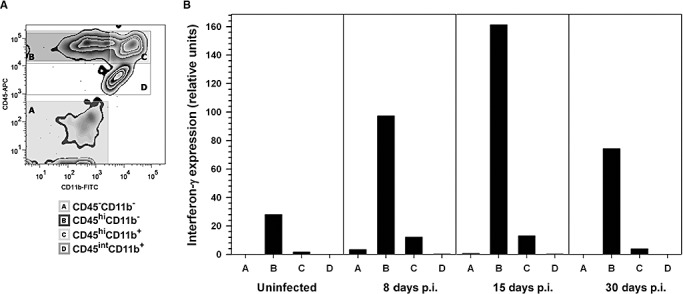
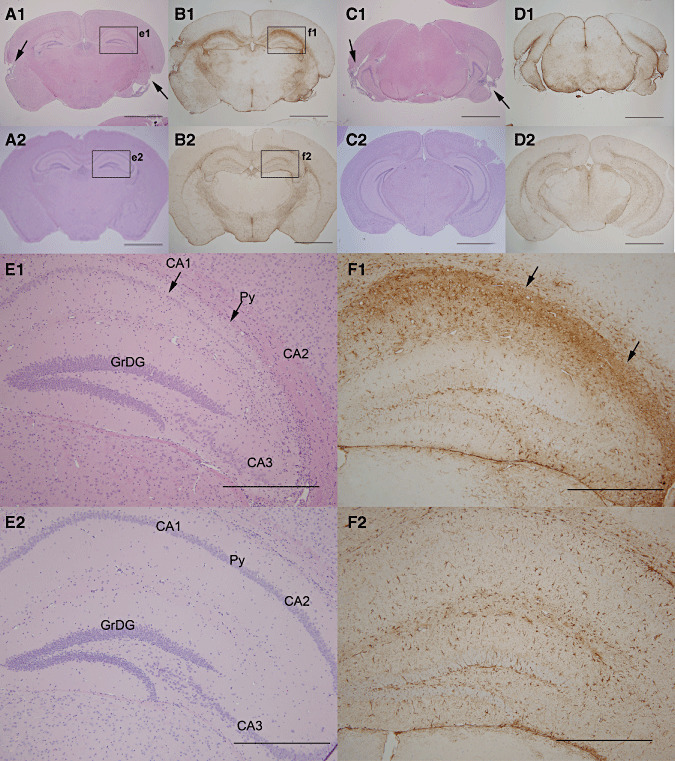
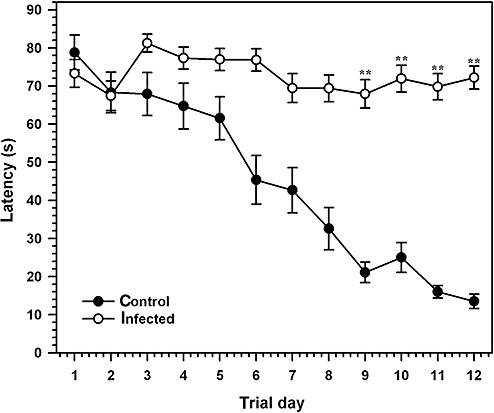
Long-term neurological sequela is common among herpes simplex encephalitis (HSE) survivors. Animal models for HSE are used to investigate mechanisms of acute disease, but little has been done to model chronic manifestations of HSE. The current study presents a detailed, systematic analysis of chronic neuropathology, including characterization of topography and sequential progression of degenerative lesions and inflammation. Subsequent to intranasal HSV-1 infection, inflammatory responses that were temporally and spatially distinct persisted in infected cortical and brain stem regions. Neutrophils were present exclusively within the olfactory bulb and brain stem regions during the acute phase of infection, while the chronic inflammation was marked by plasma cells, lymphocytes and activated microglia. The chronic lymphocytic infiltrate, cytokine production, and activated microglia were associated with the loss of cortical neuropile in the entorhinal cortex and hippocampus. Animals surviving the acute infection showed a spectrum of chronic lesions from decreased brain volume, neuronal loss, activated astrocytes, and glial scar formation to severe atrophy and cavitations of the cortex. These lesions were also associated with severe spatial memory deficits in surviving animals. Taken together, this model can be utilized to further investigate the mechanisms of neurological defects that follow in the wake of HSE.


Figures

Figure 1
Figure 1
Progression of inflammatory lesions in the brain associated with the olfactory and trigeminal nerve tracts. Representative photomicrographs of hematoxylin/eosin (HE)‐stained coronal brain sections from infected animals at 2, 5, 7, 14, 30, and 60 days p.i. Specific areas of the brain are shown, including the first cranial (olfactory) nerve/olfactory bulb [(ON)/OB; A1–F1], sensory nucleus of the trigeminal nerve (sn5; B2–F2), spinal root of the trigeminal nerve (sp5, A3–F3), and the solitary and vagus nuclei (SolN/XN; A1–A4; bar = 50 µm). The progression of inflammation in the various brains stem regions and their associated nerves demonstrating a predominant neutrophil infiltrate up to 7 days p.i., which changed to a lymphocytic and plasmacytic infiltrate at 14 days p.i.
Figure 2
Figure 2
Progression of inflammatory lesions in the Piriform cortex. Photomicrographs of representative hematoxylin/eosin (HE)‐stained coronal brain sections at 1.82 mm caudal to the Bregma. A1, B1, and C1 are shown as low magnification at 7, 30, and 60 days p.i., respectively, from which descriptive lesions are presented in the subsequent figures (bar = 2 mm). (A2–A4) During the initial stages of acute infection (7 days p.i.), signs of severe degeneration and ultimately necrosis of infected neurons were observed (A2; arrow). Scattered CD3 (A3) and Mac‐2 (A4) positive cells were present in the leptomeninges (bar = 50 µm). (B2–B4) During the chronic inflammatory phase, 30 days p.i., the piriform cortex exhibited severe atrophy with a marked loss of neurons and neuropile, which is replaced by inflammatory infiltrate (B2). The infiltrate was composed of moderate numbers of CD‐3 (B3) and Mac‐2 (B4) expressing cells (lymphocytes and macrophages, respectively; bar = 50 µm). (C2–C4) At 60 days p.i., the piriform cortex and amygdaloid nuclei showed extensive loss of neural tissue with cavitations (C2). The inflammatory infiltrates that demarcated the lesion (C2) were composed of large numbers of CD‐3 (C3) and Mac‐2 (C4) expressing cells (lymphocytes and macrophages, respectively; bar = 50 µm).
Figure 3
Figure 3
Inflammatory changes in the brain stem during herpes encephalitis. During the acute infection (7 days p.i.), inflammatory infiltration within the solitary nuclei (SolN) and vagus nucleus (XN) were composed of mostly neutrophils, and demonstrated abundant nuclear debris, cell lysis, and neurons with intranuclear viral inclusion bodies. Coronal section at 7.20 mm caudal to the bregma stained with (A) hematoxylin/eosin (HE) or immunostained for (B) myeloperoxidase, (C) Mac‐2, and (D) caspase 3 demonstrated the presence of neutrophils, activated macrophages, and apoptotic leukocytes in this region (bar = 50 µm).
Figure 4
Figure 4
Inflammatory changes in the brain stem (14 days p.i.). Changes in the brain stem at 14 days p.i. are shown in a representative coronal section at 5.52 mm caudal to the Bregma, demonstrating a severe subchronic inflammatory response in the spinal trigeminal tract/facial nerve root. (A) A hematoxylin/eosin (HE)‐stained preparation demonstrating the presence of moderate numbers of plasma cells (arrow head) and Russell bodies (arrow), (B) moderate numbers CD‐3 lymphocytes, and (C) large numbers of Mac‐2 positive phagocytes (bar = 50 µm).
Figure 5
Figure 5
Progressive astrogliosis and glial scars formation in the inflamed cortex. Photomicrographs of cortical brain sections, 1.82 mm caudal to the Bregma, obtained from infected animals at various days p.i. demonstrating the progressive astroglial activation in the cerebral cortex with no parenchymal loss and scar formation in the brainstem consequent to herpes simplex virus 1 (HSV‐1) infection. Low magnification sections immunostained for glial fibrillary acid protein (GFAP) expression are presented from (A1) uninfected animals and (A2–A3) corresponding high magnification micrographs denoting normal structure and numbers of GFAP positive cells in the uninfected brain. Similar low magnification coronal sections taken at (B1) 14 days p.i. and (C1) 30 days p.i. showed an chronic increase in GFAP signal across many brain structures (bar = 2 mm). (B2–B3) At 14 days p.i., magnification of the parietal cortex (B2) and amygdaloid nuclei (B3) showed a locally extensive astrocyte reaction (bar = 50 µm), particularly in the amygdaloid nuclei, astrogliosis was located around areas of lymphocytic perivasculitis. (C2–C3) Astrogliosis at 30 days p.i. (bar = 2 mm) was observed as hypertrophic astrocytes (C2) possessing prominent cell processes and strong GFAP‐expression indicative of glial scar formation (C3, bar = 50 µm). (D–E) Similar astrogliosis was observed in the brain stem regions. Brain cross sections at 7.76 mm caudal to the Bregma from uninfected animals (D) compared with infected brains at 30 days p.i. (E) showed a diffuse astrogliosis in the infected brain stem. Severe astrogliosis was observed in the caudal part of the spinal trigeminal nucleus and glial scar formation (arrow) in the spinal trigeminal track (bar = 0.5 mm).
Figure 6
Figure 6
Interferon gamma expression by brain‐infiltrating leukocytes. Single cell suspensions of brain tissue obtained from herpes simplex virus 1 (HSV‐1)‐infected mice (five animals, 30 days p.i.) were layered on a 70% Percoll cushion. (A) Brain leukocytes banded at the 30%–70% Percoll interface were collected, labeled with mouse antibodies specific for CD45 and CD11b, and sorted into four populations using fluorescence‐activated cell sorter (FACS): A‐ CD45CD11b non‐myeloid cells, B‐ CD45hiCD11b predominantly lymphocytes, C‐ CD45hiCD11b+ are infiltrating macrophages or neutrophils, and D‐CD45intCD11b+, microglial cells. Post‐sort analysis indicated that the separated populations were >93% positive for their associated surface markers. (B) Total RNA extracted from each of the separated populations (A through D) at 30 days p.i. was analyzed by real‐time reverse transcription polymerase chain reaction (RT‐PCR) for interferon (IFN)‐γ expression. Relative transcript levels in cells isolated from brain tissues of five animals normalized to the housekeeping gene, HPRT, expression are presented.
Figure 7
Figure 7
Chronic cortical and hippocampal lesions at 60 days p.i. Low magnification photomicrographs presenting the brain of a mouse showing severe atrophy and cavitations of cortical structures at 60 days p.i. (A1) Hematoxylin/eosin (HE)‐stained coronal section, 1.82 mm caudal to Bregma, from infected and (A2) uninfected age‐matched animal, demonstrating bilateral chronic temporal cortical atrophy with cavitations (arrows). (B1) Adjacent sections (–1.82 mm) stained with GFAP shown a diffuse severe astrogliosis and hypertrophic astrocytes. Notice the intense and extensive GFAP‐expression demonstrating hypertrophic astrocytes in a glial scar formation (B2) compared with the same region in uninfected animals. (C1) Similar HE‐stained coronal sections at 3.16 mm caudal to bregma show cavitations and atrophy of the entorhinal cortex (arrows) compared with (C2) uninfected age‐matched controls. (D1) Adjacent sections stained with GFAP showed a diffuse severe astrogliosis compared (D2) with similar region in uninfected brains (Bar = 2.0 mm). (E1) High power examination of the HE stained coronal brain section, presented in A1, exhibited severe loss of neurons of the CA1, CA2, and CA3 regions of hippocampus compared with (E2) age‐matched, uninfected control controls (bar = 0.5 mm). (F1) This loss of neuronal structure in the hippocampus was associated with severe astrogliosis, characterized by a strong expression of GFAP in concurring CA areas compared with (F2) similar regions in uninfected, age‐matched control brains. (Bar = 0.5 mm). Py = pyramidal neurons, GrDG = granular cell layer of the dentate gyrus.
Figure 8
Figure 8
Herpes simplex encephalitis (HSE) results in a spatial memory defect on a Morris maze task. Performance of herpes simplex virus 1 (HSV‐1) ‐infected mice at 30 days p.i. and age‐matched uninfected controls were tested on a Morris water maze designed to measure spatial memory formation. Average latency associated with finding an invisible platform based on visual cues was measured daily for 12 days, with each animal receiving 4 trials/days from the same quadrant of the maze. Uninfected Balb/c (open circles) mice demonstrated lower latency rates than HSV‐1‐infected animals, indicating a severe spatial memory defect. A visual probe test was used to eliminate animals that could not find a visible platform after 4 trials. Data presented are mean latency (±Standard error of mean (SEM)) from six uninfected animals and 10 HSV‐1 infected animals with no visual deficits (**P < 0.001).

Similar articles

Cited by

References

    1. Anderson JR, Field HJ (1983) The distribution of herpes simplex type 1 antigen in mouse central nervous system after different routes of inoculation. J Neurol Sci 60:181–195. - PubMed
    1. Aurelius E, Andersson B, Forsgren M, Skoldenberg B, Strannegard O (1994) Cytokines and other markers of intrathecal immune response in patients with herpes simplex encephalitis. J Infect Dis 170:678–681. - PubMed
    1. Banerjee K, Biswas PS, Kim B, Lee S, Rouse BT (2004) CXCR2‐/‐ mice show enhanced susceptibility to herpetic stromal keratitis: a role for IL‐6‐induced neovascularization. J Immunol 172:1237–1245. - PubMed
    1. Baringer JR (2008) Herpes simplex infections of the nervous system. Neurol Clin 26:657–674. - PubMed
    1. Beers DR, Henkel JS, Schaefer DC, Rose JW, Stroop WG (1993) Neuropathology of herpes simplex virus encephalitis in a rat seizure model. J Neuropathol Exp Neurol 52:241–252. - PubMed

Publication types

MeSH terms