

Multiplex real-time quantitative PCR, microscopy and rapid diagnostic immuno-chromatographic tests for the detection of Plasmodium spp: performance, limit of detection analysis and quality assurance
- PMID: 20003199
- PMCID: PMC2796674
- DOI: 10.1186/1475-2875-8-284
Multiplex real-time quantitative PCR, microscopy and rapid diagnostic immuno-chromatographic tests for the detection of Plasmodium spp: performance, limit of detection analysis and quality assurance
Abstract
Background: Accurate laboratory diagnosis of malaria species in returning travelers is paramount in the treatment of this potentially fatal infectious disease.
Materials and methods: A total of 466 blood specimens from returning travelers to Africa, Asia, and South/Central America with suspected malaria infection were collected between 2007 and 2009 at the reference public health laboratory. These specimens were assessed by reference microscopy, multipex real-time quantitative polymerase chain reaction (QPCR), and two rapid diagnostic immuno-chromatographic tests (ICT) in a blinded manner. Key clinical laboratory parameters such as limit of detection (LOD) analysis on clinical specimens by parasite stage, inter-reader variability of ICTs, staffing implications, quality assurance and cost analysis were evaluated.
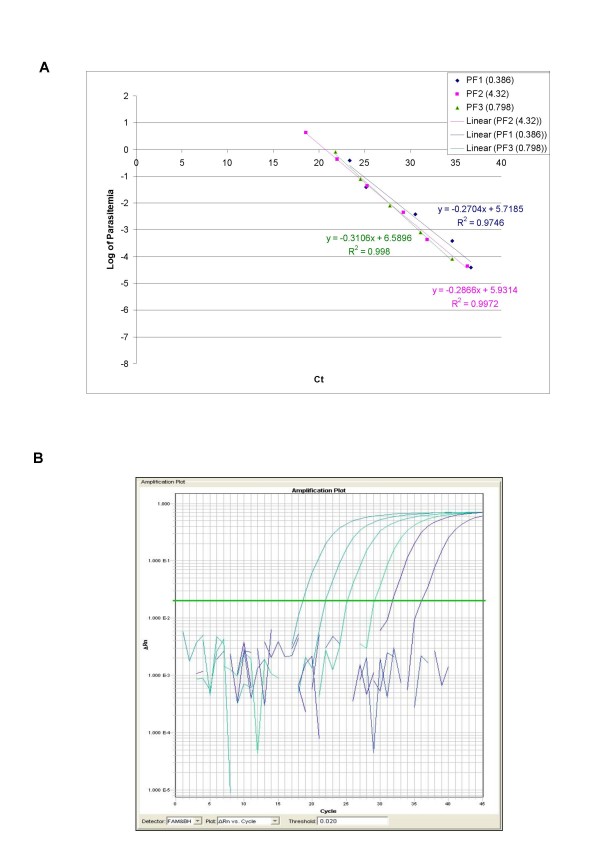
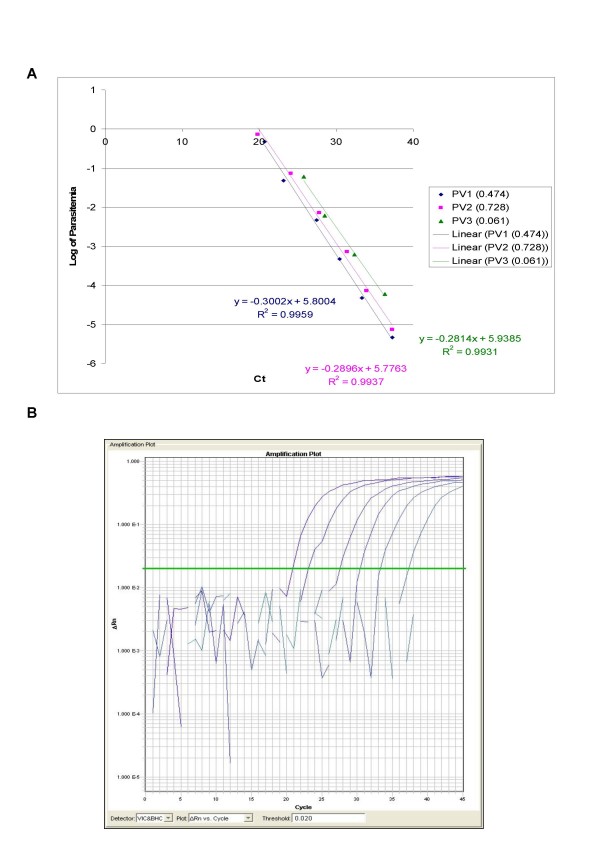
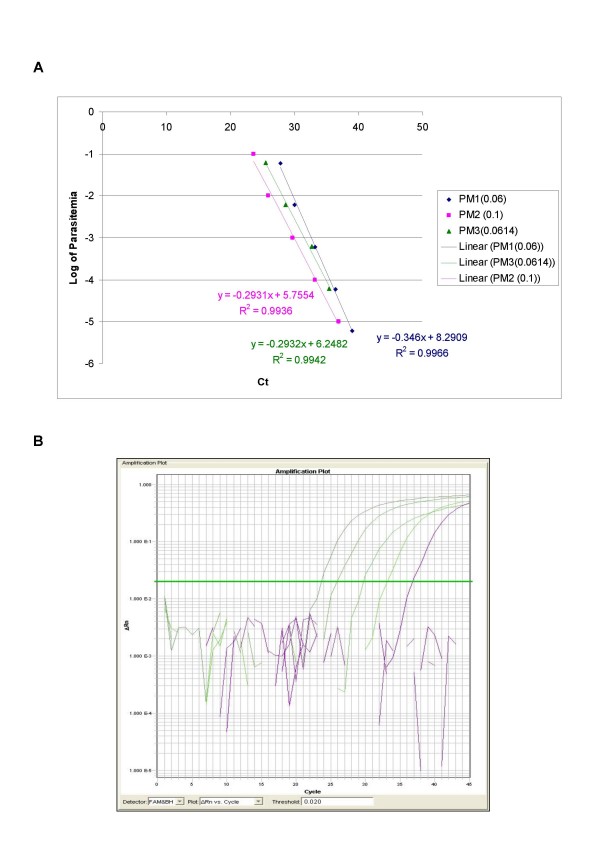
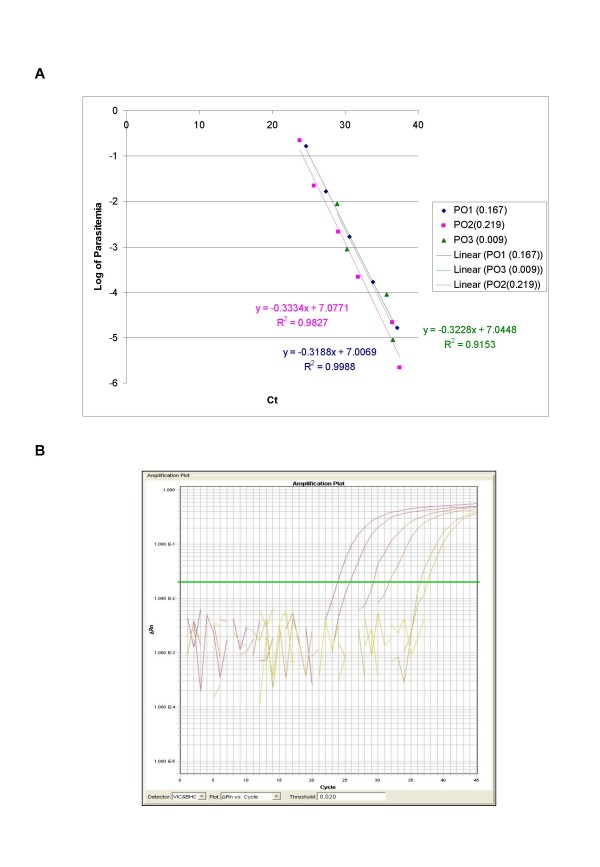
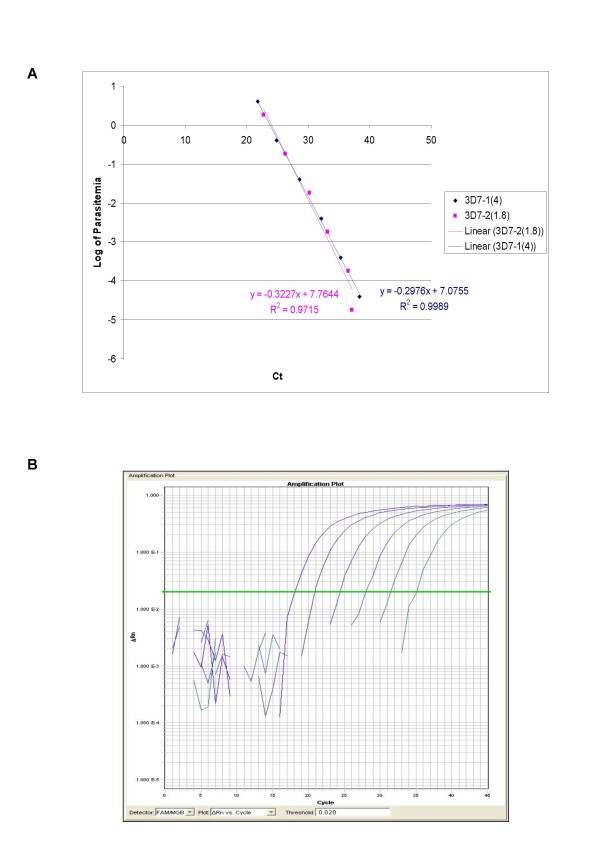
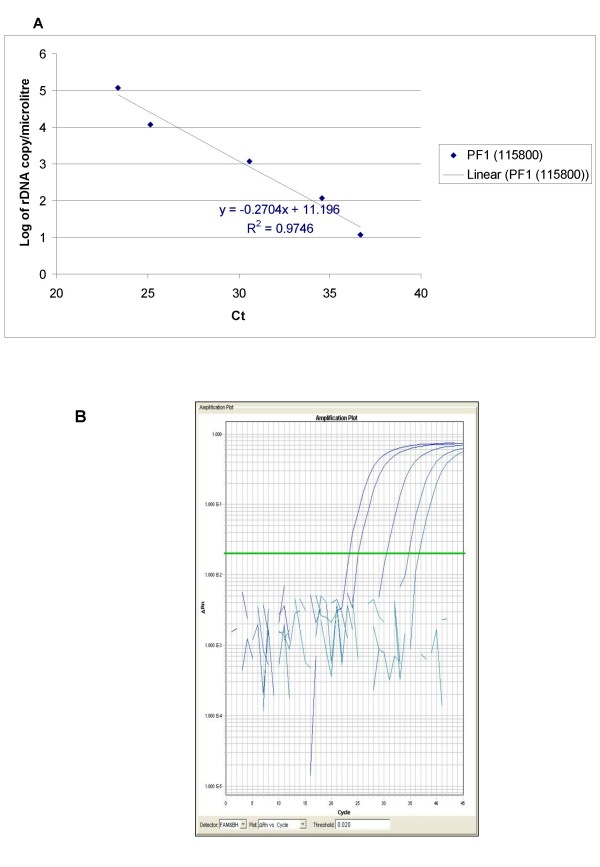
Results: QPCR is the most analytically sensitive method (sensitivity 99.41%), followed by CARESTART (sensitivity 88.24%), and BINAXNOW (sensitivity 86.47%) for the diagnosis of malaria in returning travelers when compared to reference microscopy. However, microscopy was unable to specifically identify Plasmodia spp. in 18 out of 170 positive samples by QPCR. Moreover, the 17 samples that were negative by microscopy and positive by QPCR were also positive by ICTs. Quality assurance was achieved for QPCR by exchanging a blinded proficiency panel with another reference laboratory. The Kappa value of inter-reader variability among three readers for BINAXNOW and CARESTART was calculated to be 0.872 and 0.898 respectively. Serial dilution studies demonstrated that the QPCR cycle threshold correlates linearly with parasitemia (R(2) = 0.9746) in a clinically relevant dynamic range and retains a LOD of 11 rDNA copies/microl for P. falciparum, which was several log lower than reference microscopy and ICTs. LOD for QPCR is affected not only by parasitemia but the parasite stage distribution of each clinical specimen. QPCR was approximately 6-fold more costly than reference microscopy.
Discussion: These data suggest that multiplex QPCR although more costly confers a significant diagnostic advantage in terms of LOD compared to reference microscopy and ICTs for all four species. Quality assurance of QPCR is essential to the maintenance of proficiency in the clinical laboratory. ICTs showed good concordance between readers however lacked sensitivity for non-falciparum species due to antigenic differences and low parasitemia.
Conclusion: Multiplex QPCR but not ICTs is an essential adjunct to microscopy in the reference laboratory detection of malaria species specifically due to the superior LOD. ICTs are better suited to the non-reference laboratory where lower specimen volumes challenge microscopy proficiency in the non-endemic setting.
Figures
References
-
- Labbe AC, Pillai DR, Hongvangthong B, Vanisaveth V, Pomphida S, Inkathone S, Hay Burgess DC, Kain KC. The performance and utility of rapid diagnostic assays for Plasmodium falciparum malaria in a field setting in the Lao People's Democratic Republic. Ann Trop Med Parasitol. 2001;95:671–677. doi: 10.1080/00034980120103243. - DOI - PubMed
Publication types
MeSH terms
Substances
LinkOut - more resources
Full Text Sources
Other Literature Sources
Medical
Miscellaneous
