Automated mass action model space generation and analysis methods for two-reactant combinatorially complex equilibriums: an analysis of ATP-induced ribonucleotide reductase R1 hexamerization data
- PMID: 20003203
- PMCID: PMC2799446
- DOI: 10.1186/1745-6150-4-50
Automated mass action model space generation and analysis methods for two-reactant combinatorially complex equilibriums: an analysis of ATP-induced ribonucleotide reductase R1 hexamerization data
Abstract
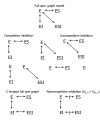
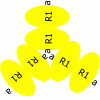
Background: Ribonucleotide reductase is the main control point of dNTP production. It has two subunits, R1, and R2 or p53R2. R1 has 5 possible catalytic site states (empty or filled with 1 of 4 NDPs), 5 possible s-site states (empty or filled with ATP, dATP, dTTP or dGTP), 3 possible a-site states (empty or filled with ATP or dATP), perhaps two possible h-site states (empty or filled with ATP), and all of this is folded into an R1 monomer-dimer-tetramer-hexamer equilibrium where R1 j-mers can be bound by variable numbers of R2 or p53R2 dimers. Trillions of RNR complexes are possible as a result. The problem is to determine which are needed in models to explain available data. This problem is intractable for 10 reactants, but it can be solved for 2 and is here for R1 and ATP.
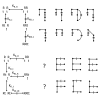
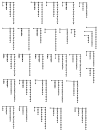
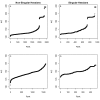
Results: Thousands of ATP-induced R1 hexamerization models with up to three (s, a and h) ATP binding sites per R1 subunit were automatically generated via hypotheses that complete dissociation constants are infinite and/or that binary dissociation constants are equal. To limit the model space size, it was assumed that s-sites are always filled in oligomers and never filled in monomers, and to interpret model terms it was assumed that a-sites fill before h-sites. The models were fitted to published dynamic light scattering data. As the lowest Akaike Information Criterion (AIC) of the 3-parameter models was greater than the lowest of the 2-parameter models, only models with up to 3 parameters were fitted. Models with sums of squared errors less than twice the minimum were then partitioned into two groups: those that contained no occupied h-site terms (508 models) and those that contained at least one (1580 models). Normalized AIC densities of these two groups of models differed significantly in favor of models that did not include an h-site term (Kolmogorov-Smirnov p < 1 x 10(-15)); consistent with this, 28 of the top 30 models (ranked by AICs) did not include an h-site term and 28/30 > 508/2088 with p < 2 x 10(-15). Finally, 99 of the 2088 models did not have any terms with ATP/R1 ratios >1.5, but of the top 30, there were 14 such models (14/30 > 99/2088 with p < 3 x 10(-16)), i.e. the existence of R1 hexamers with >3 a-sites occupied by ATP is also not supported by this dataset.
Conclusion: The analysis presented suggests that three a-sites may not be occupied by ATP in R1 hexamers under the conditions of the data analyzed. If a-sites fill before h-sites, this implies that the dataset analyzed can be explained without the existence of an h-site.
Figures





Similar articles
-
A kinetic study on the influence of nucleoside triphosphate effectors on subunit interaction in mouse ribonucleotide reductase.Biochemistry. 1996 Jul 2;35(26):8603-9. doi: 10.1021/bi960184n. Biochemistry. 1996. PMID: 8679622
-
Comprehensive model for allosteric regulation of mammalian ribonucleotide reductase: refinements and consequences.Biochemistry. 2003 Feb 18;42(6):1696-706. doi: 10.1021/bi020634d. Biochemistry. 2003. PMID: 12578384
-
A comprehensive model for the allosteric regulation of mammalian ribonucleotide reductase. Functional consequences of ATP- and dATP-induced oligomerization of the large subunit.Biochemistry. 2002 Jan 15;41(2):462-74. doi: 10.1021/bi011653a. Biochemistry. 2002. PMID: 11781084
-
Changes in deoxynucleoside triphosphate pools induced by inhibitors and modulators of ribonucleotide reductase.Pharmacol Ther. 1985;30(1):31-42. doi: 10.1016/0163-7258(85)90046-4. Pharmacol Ther. 1985. PMID: 3915820 Review.
-
DNA building blocks: keeping control of manufacture.Crit Rev Biochem Mol Biol. 2012 Jan-Feb;47(1):50-63. doi: 10.3109/10409238.2011.630372. Epub 2011 Nov 3. Crit Rev Biochem Mol Biol. 2012. PMID: 22050358 Free PMC article. Review.
Cited by
-
Molecular Strategies of Deoxynucleotide Triphosphate Supply Inhibition Used in the Treatment of Gynecologic Malignancies.Gynecol Obstet (Sunnyvale). 2011 Dec 10;Suppl 4:001. doi: 10.4172/2161-0932.s4-001. Gynecol Obstet (Sunnyvale). 2011. PMID: 25392744 Free PMC article.
-
Therapeutic Mechanisms of Treatment in Cervical and Vaginal Cancer.Oncol Hematol Rev. 2012 Spring;8(1):55-60. Oncol Hematol Rev. 2012. PMID: 22943045 Free PMC article.
-
Hydroxyurea-The Good, the Bad and the Ugly.Genes (Basel). 2021 Jul 19;12(7):1096. doi: 10.3390/genes12071096. Genes (Basel). 2021. PMID: 34356112 Free PMC article. Review.
-
On model ensemble analyses of nonmonotonic data.Nucleosides Nucleotides Nucleic Acids. 2012;31(2):147-56. doi: 10.1080/15257770.2011.644370. Nucleosides Nucleotides Nucleic Acids. 2012. PMID: 22303993 Free PMC article.
References
-
- Kroep JR, Van Moorsel CJ, Veerman G, Voorn DA, Schultz RM, Worzalla JF, Tanzer LR, Merriman RL, Pinedo HM, Peters GJ. Role of deoxycytidine kinase (dCK), thymidine kinase 2 (TK2), and deoxycytidine deaminase (dCDA) in the antitumor activity of gemcitabine (dFdC) Adv Exp Med Biol. 1998;431:657–660. - PubMed
-
- Shewach DS, Reynolds KK, Hertel L. Nucleotide specificity of human deoxycytidine kinase. Mol Pharmacol. 1992;42(3):518–524. - PubMed
Publication types
MeSH terms
Substances
Grants and funding
LinkOut - more resources
Full Text Sources
Research Materials

