

Pressure-dependent stress relaxation in acute respiratory distress syndrome and healthy lungs: an investigation based on a viscoelastic model
- PMID: 20003211
- PMCID: PMC2811954
- DOI: 10.1186/cc8203
Pressure-dependent stress relaxation in acute respiratory distress syndrome and healthy lungs: an investigation based on a viscoelastic model
Abstract
Introduction: Limiting the energy transfer between ventilator and lung is crucial for ventilatory strategy in acute respiratory distress syndrome (ARDS). Part of the energy is transmitted to the viscoelastic tissue components where it is stored or dissipates. In mechanically ventilated patients, viscoelasticity can be investigated by analyzing pulmonary stress relaxation. While stress relaxation processes of the lung have been intensively investigated, non-linear interrelations have not been systematically analyzed, and such analyses have been limited to small volume or pressure ranges. In this study, stress relaxation of mechanically ventilated lungs was investigated, focusing on non-linear dependence on pressure. The range of inspiratory capacity was analyzed up to a plateau pressure of 45 cmH2O.
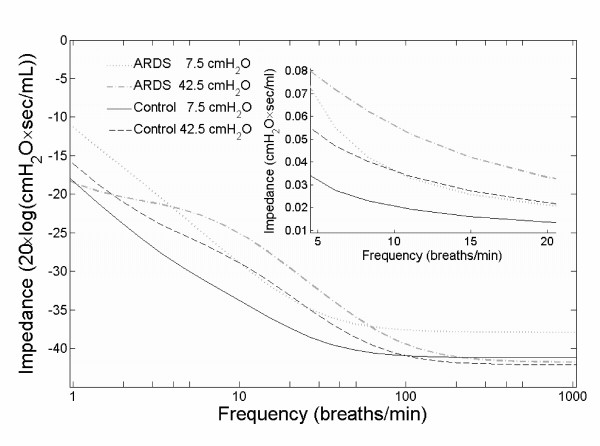
Methods: Twenty ARDS patients and eleven patients with normal lungs under mechanical ventilation were included. Rapid flow interruptions were repetitively applied using an automated super-syringe maneuver. Viscoelastic resistance, compliance and time constant were determined by multiple regression analysis using a lumped parameter model. This same viscoelastic model was used to investigate the frequency dependence of the respiratory system's impedance.
Results: The viscoelastic time constant was independent of pressure, and it did not differ between normal and ARDS lungs. In contrast, viscoelastic resistance increased non-linearly with pressure (normal: 8.4 (7.4-11.9) [median (lower - upper quartile)] to 35.2 (25.6-39.5) cmH2O.sec/L; ARDS: 11.9 (9.2-22.1) to 73.5 (56.8-98.7)cmH2O.sec/L), and viscoelastic compliance decreased non-linearly with pressure (normal: 130.1(116.9-151.3) to 37.4(34.7-46.3) mL/cmH2O; ARDS: 125.8(80.0-211.0) to 17.1(13.8-24.7)mL/cmH2O). The pulmonary impedance increased with pressure and decreased with respiratory frequency.
Conclusions: Viscoelastic compliance and resistance are highly non-linear with respect to pressure and differ considerably between ARDS and normal lungs. None of these characteristics can be observed for the viscoelastic time constant. From our analysis of viscoelastic properties we cautiously conclude that the energy transfer from the respirator to the lung can be reduced by application of low inspiratory plateau pressures and high respiratory frequencies. This we consider to be potentially lung protective.
Figures
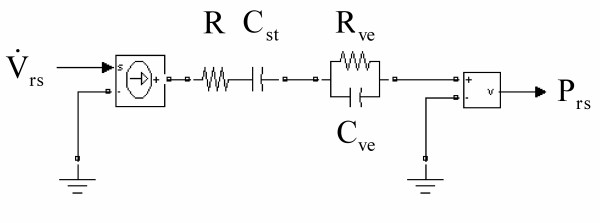
 represents the input and the respiratory pressure Prs the output of the model.
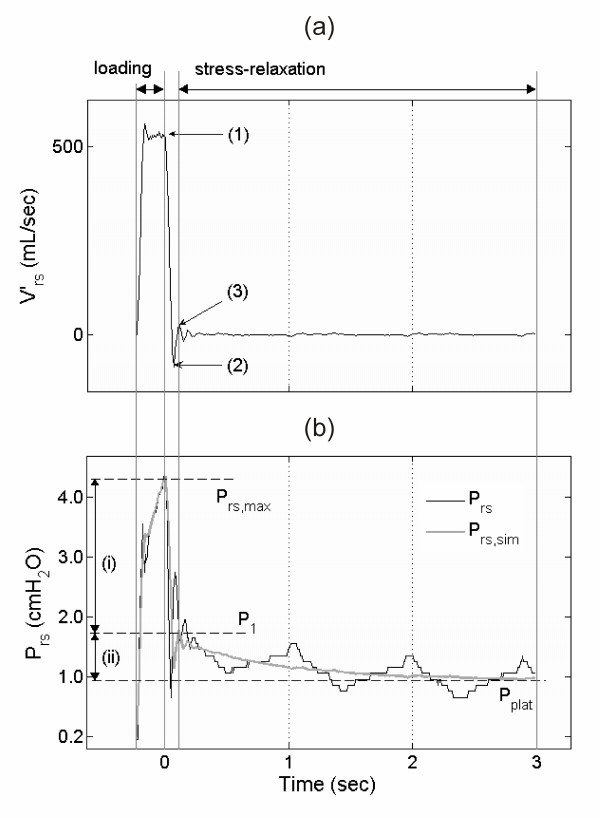 and (b) pressure Prs time-series of one 100 mL volume step including the phases of volume loading ( >0 mL/sec) and stress relaxation ( = 0 mL/sec during occlusion interval). (a) Labeled points indicate: (1) start of valve closure, (2) flow falling below zero due to valve characteristics, (3) estimated end of valve closure. The data between (1) and (3) were excluded from the fitting process [see Additional file 1]. (b) Prs with maximum pressure (Prs, max) and approximated plateau pressure (Pplat). Prs, sim depicts the model-simulated respiratory pressure by use of the fitted parameter values. (i) denotes the initial resistive pressure drop (Prs, max down to P1), (ii) denotes the succeeding slow pressure change indicating stress relaxation between level P1 and Pplat.
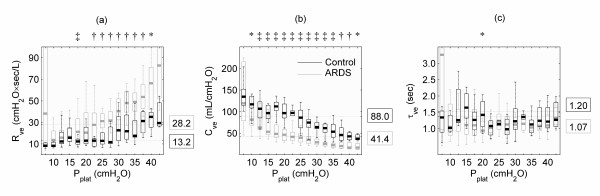
Similar articles
-
Stress-strain curve and elastic behavior of the fibrotic lung with usual interstitial pneumonia pattern during protective mechanical ventilation.Sci Rep. 2024 Jun 7;14(1):13158. doi: 10.1038/s41598-024-63670-z. Sci Rep. 2024. PMID: 38849437 Free PMC article.
-
Sigh: tool to determine the respiratory viscoelastic properties.J Clin Monit Comput. 2002 Dec;17(7-8):459-66. doi: 10.1023/a:1026277004613. J Clin Monit Comput. 2002. PMID: 14650641
-
Negative- versus positive-pressure ventilation in intubated patients with acute respiratory distress syndrome.Crit Care. 2012 Dec 12;16(2):R37. doi: 10.1186/cc11216. Crit Care. 2012. PMID: 22386062 Free PMC article.
-
Techniques for measuring respiratory mechanics: an analytic approach with a viscoelastic model.J Appl Physiol (1985). 1993 May;74(5):2373-9. doi: 10.1152/jappl.1993.74.5.2373. J Appl Physiol (1985). 1993. PMID: 8335570 Review.
-
Regional physiology of ARDS.Crit Care. 2017 Dec 28;21(Suppl 3):312. doi: 10.1186/s13054-017-1905-9. Crit Care. 2017. PMID: 29297365 Free PMC article. Review.
Cited by
-
Non-Canonical Regulation of Type I Collagen through Promoter Binding of SOX2 and Its Contribution to Ameliorating Pulmonary Fibrosis by Butylidenephthalide.Int J Mol Sci. 2018 Oct 4;19(10):3024. doi: 10.3390/ijms19103024. Int J Mol Sci. 2018. PMID: 30287739 Free PMC article.
-
Respiratory system dynamical mechanical properties: modeling in time and frequency domain.Biophys Rev. 2011 Jun;3(2):71. doi: 10.1007/s12551-011-0048-5. Epub 2011 May 19. Biophys Rev. 2011. PMID: 28510005 Free PMC article. Review.
-
Positive- and Negative-Pressure Ventilation Characterized by Local and Global Pulmonary Mechanics.Am J Respir Crit Care Med. 2023 Mar 1;207(5):577-586. doi: 10.1164/rccm.202111-2480OC. Am J Respir Crit Care Med. 2023. PMID: 36194677 Free PMC article.
-
An enhanced respiratory mechanics model based on double-exponential and fractional calculus.Front Physiol. 2023 Dec 4;14:1273645. doi: 10.3389/fphys.2023.1273645. eCollection 2023. Front Physiol. 2023. PMID: 38111899 Free PMC article.
-
Expiratory model-based method to monitor ARDS disease state.Biomed Eng Online. 2013 Jun 26;12:57. doi: 10.1186/1475-925X-12-57. Biomed Eng Online. 2013. PMID: 23802683 Free PMC article.
References
-
- Dreyfuss D, Saumon G. Ventilator-induced lung injury: lessons from experimental studies. Am J Resp Crit Care Med. 1998;157:294–323. - PubMed
Publication types
MeSH terms
LinkOut - more resources
Full Text Sources
