

Exploring biological network structure with clustered random networks
- PMID: 20003212
- PMCID: PMC2801686
- DOI: 10.1186/1471-2105-10-405
Exploring biological network structure with clustered random networks
Abstract
Background: Complex biological systems are often modeled as networks of interacting units. Networks of biochemical interactions among proteins, epidemiological contacts among hosts, and trophic interactions in ecosystems, to name a few, have provided useful insights into the dynamical processes that shape and traverse these systems. The degrees of nodes (numbers of interactions) and the extent of clustering (the tendency for a set of three nodes to be interconnected) are two of many well-studied network properties that can fundamentally shape a system. Disentangling the interdependent effects of the various network properties, however, can be difficult. Simple network models can help us quantify the structure of empirical networked systems and understand the impact of various topological properties on dynamics.
Results: Here we develop and implement a new Markov chain simulation algorithm to generate simple, connected random graphs that have a specified degree sequence and level of clustering, but are random in all other respects. The implementation of the algorithm (ClustRNet: Clustered Random Networks) provides the generation of random graphs optimized according to a local or global, and relative or absolute measure of clustering. We compare our algorithm to other similar methods and show that ours more successfully produces desired network characteristics.Finding appropriate null models is crucial in bioinformatics research, and is often difficult, particularly for biological networks. As we demonstrate, the networks generated by ClustRNet can serve as random controls when investigating the impacts of complex network features beyond the byproduct of degree and clustering in empirical networks.
Conclusion: ClustRNet generates ensembles of graphs of specified edge structure and clustering. These graphs allow for systematic study of the impacts of connectivity and redundancies on network function and dynamics. This process is a key step in unraveling the functional consequences of the structural properties of empirical biological systems and uncovering the mechanisms that drive these systems.
Figures
 ≈ 0,(b) = 0.1,(c) = 0.5 and (d) = 0.8, with the connectivity constraint.
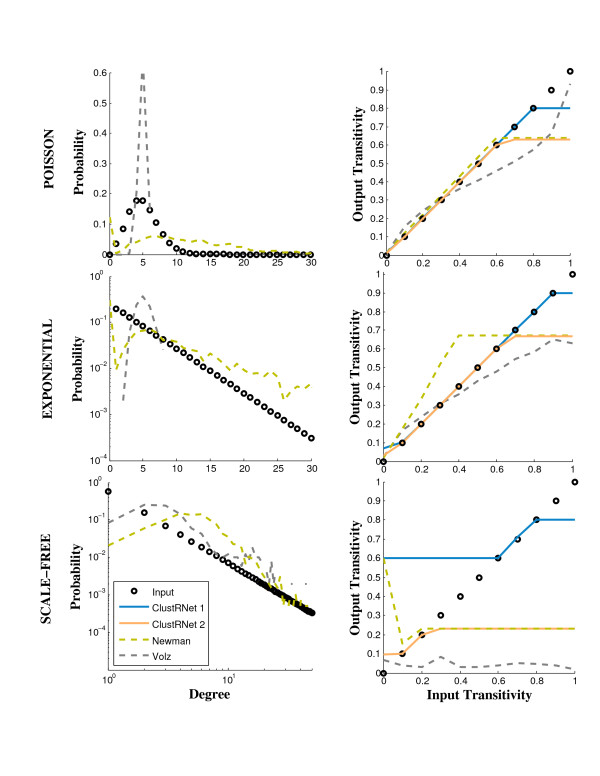 )) as the clustering measure in ClustRNet (blue line), and (2) ClustRNet [without a connectivity constraint] (orange line), the Newman algorithm (green dashed line) and the Volz algorithm (gray dashed line), all with transitivity (()) as the clustering measure.
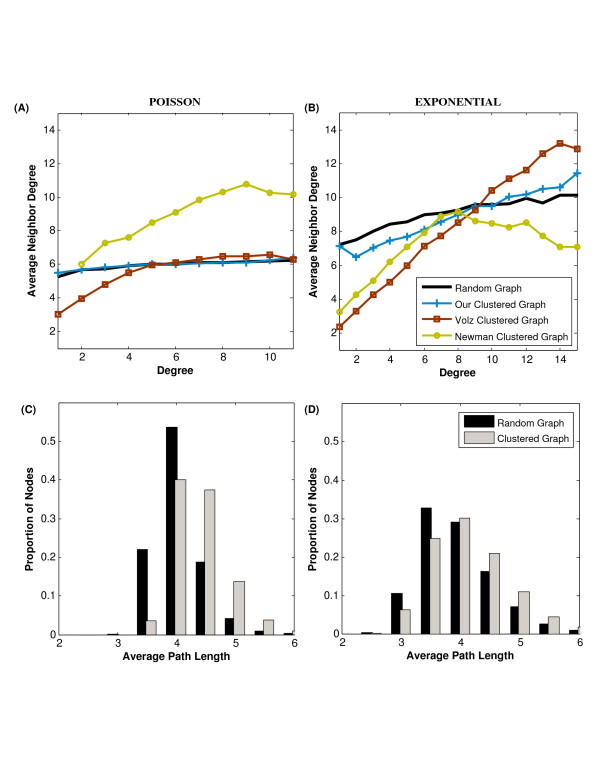
Similar articles
-
Exploring community structure in biological networks with random graphs.BMC Bioinformatics. 2014 Jun 25;15:220. doi: 10.1186/1471-2105-15-220. BMC Bioinformatics. 2014. PMID: 24965130 Free PMC article.
-
New Markov-Shannon Entropy models to assess connectivity quality in complex networks: from molecular to cellular pathway, Parasite-Host, Neural, Industry, and Legal-Social networks.J Theor Biol. 2012 Jan 21;293:174-88. doi: 10.1016/j.jtbi.2011.10.016. Epub 2011 Oct 25. J Theor Biol. 2012. PMID: 22037044
-
Optimized null model for protein structure networks.PLoS One. 2009 Jun 26;4(6):e5967. doi: 10.1371/journal.pone.0005967. PLoS One. 2009. PMID: 19557139 Free PMC article.
-
Network visualization and network analysis.EXS. 2007;97:245-75. doi: 10.1007/978-3-7643-7439-6_11. EXS. 2007. PMID: 17432271 Review.
-
From chemical graphs in computer-aided drug design to general Markov-Galvez indices of drug-target, proteome, drug-parasitic disease, technological, and social-legal networks.Curr Comput Aided Drug Des. 2011 Dec;7(4):315-37. doi: 10.2174/157340911798260340. Curr Comput Aided Drug Des. 2011. PMID: 22050683 Review.
Cited by
-
Simple topological features reflect dynamics and modularity in protein interaction networks.PLoS Comput Biol. 2013;9(10):e1003243. doi: 10.1371/journal.pcbi.1003243. Epub 2013 Oct 10. PLoS Comput Biol. 2013. PMID: 24130468 Free PMC article.
-
Systems biology, emergence and antireductionism.Saudi J Biol Sci. 2016 Sep;23(5):584-91. doi: 10.1016/j.sjbs.2015.06.015. Epub 2015 Jun 27. Saudi J Biol Sci. 2016. PMID: 27579007 Free PMC article.
-
Networks and the epidemiology of infectious disease.Interdiscip Perspect Infect Dis. 2011;2011:284909. doi: 10.1155/2011/284909. Epub 2011 Mar 16. Interdiscip Perspect Infect Dis. 2011. PMID: 21437001 Free PMC article.
-
Untangling the Interplay between Epidemic Spread and Transmission Network Dynamics.PLoS Comput Biol. 2010 Nov 18;6(11):e1000984. doi: 10.1371/journal.pcbi.1000984. PLoS Comput Biol. 2010. PMID: 21124951 Free PMC article.
-
Is network clustering detectable in transmission trees?Viruses. 2011 Jun;3(6):659-76. doi: 10.3390/v3060659. Viruses. 2011. PMID: 21731813 Free PMC article.
References
-
- Watts D, Strogatz SH. Collective dynamics of small world networks. Nature. 1998;393(441) - PubMed
-
- Ulanowicz RE, Bondavalli C, Egnotovich MS. Network analysis of trophic dynamics in south florida ecosystem, FY 97: The florida bay ecosystem. Technical Report Ref. No. [UMCES] CBL. 1998. pp. 98–123.
-
- Colizza V, Flammini A, Maritan A, Vespignani A. Characterization and modeling of protein-protein interaction networks. Physica A. 2005;352:1–27. doi: 10.1016/j.physa.2004.12.030. - DOI
Publication types
MeSH terms
Substances
LinkOut - more resources
Full Text Sources
Research Materials
