

Stratification of the severity of critically ill patients with classification trees
- PMID: 20003229
- PMCID: PMC2797013
- DOI: 10.1186/1471-2288-9-83
Stratification of the severity of critically ill patients with classification trees
Abstract
Background: Development of three classification trees (CT) based on the CART (Classification and Regression Trees), CHAID (Chi-Square Automatic Interaction Detection) and C4.5 methodologies for the calculation of probability of hospital mortality; the comparison of the results with the APACHE II, SAPS II and MPM II-24 scores, and with a model based on multiple logistic regression (LR).
Methods: Retrospective study of 2864 patients. Random partition (70:30) into a Development Set (DS) n = 1808 and Validation Set (VS) n = 808. Their properties of discrimination are compared with the ROC curve (AUC CI 95%), Percent of correct classification (PCC CI 95%); and the calibration with the Calibration Curve and the Standardized Mortality Ratio (SMR CI 95%).
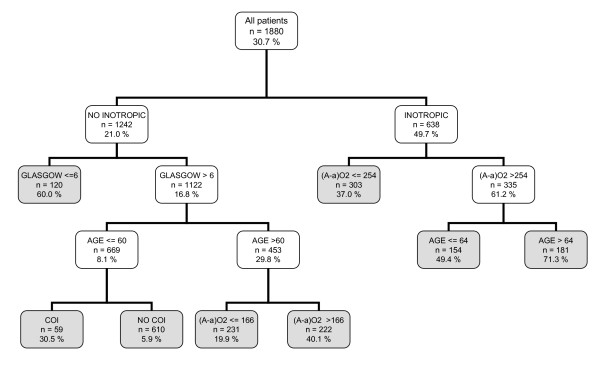
Results: CTs are produced with a different selection of variables and decision rules: CART (5 variables and 8 decision rules), CHAID (7 variables and 15 rules) and C4.5 (6 variables and 10 rules). The common variables were: inotropic therapy, Glasgow, age, (A-a)O2 gradient and antecedent of chronic illness. In VS: all the models achieved acceptable discrimination with AUC above 0.7. CT: CART (0.75(0.71-0.81)), CHAID (0.76(0.72-0.79)) and C4.5 (0.76(0.73-0.80)). PCC: CART (72(69-75)), CHAID (72(69-75)) and C4.5 (76(73-79)). Calibration (SMR) better in the CT: CART (1.04(0.95-1.31)), CHAID (1.06(0.97-1.15) and C4.5 (1.08(0.98-1.16)).
Conclusion: With different methodologies of CTs, trees are generated with different selection of variables and decision rules. The CTs are easy to interpret, and they stratify the risk of hospital mortality. The CTs should be taken into account for the classification of the prognosis of critically ill patients.
Figures


References
Publication types
MeSH terms
LinkOut - more resources
Full Text Sources
Research Materials
Miscellaneous
