

Effects of chromium picolinate on glycemic control and kidney of the obese Zucker rat
- PMID: 20003253
- PMCID: PMC2799425
- DOI: 10.1186/1743-7075-6-51
Effects of chromium picolinate on glycemic control and kidney of the obese Zucker rat
Abstract
Background: Chromium picolinate (Cr(pic)3) is advocated as adjuvant therapy for impaired glycemic control, despite concerns for DNA damage. Potential toxicity of Cr(pic)3 should be greater for the kidney that accumulates chromium. Therefore, we tested the hypothesis that Cr(pic)3 treatment of obese Zucker rats (OZR) exacerbates renal abnormalities associated with dysglycemia.
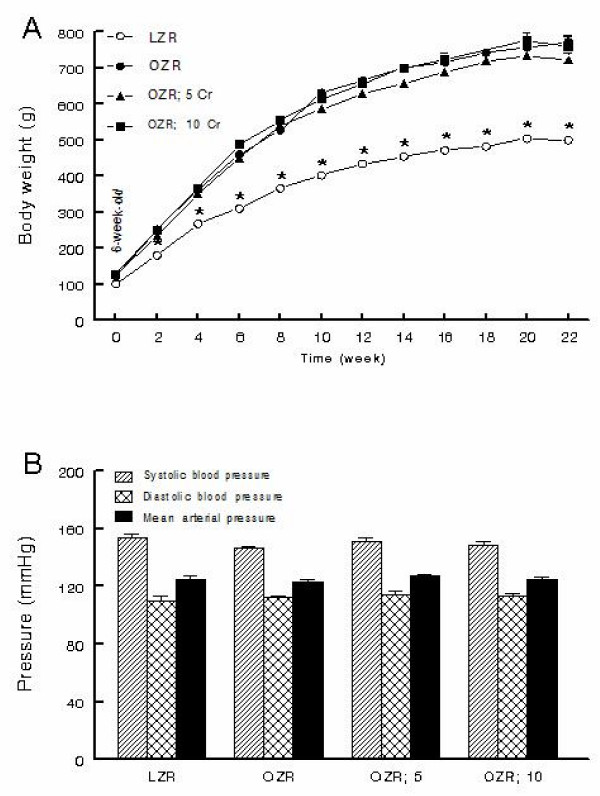
Methods: Male OZR were treated with diets lacking or containing 5 and 10 mg/kg of chromium, as Cr(pic)3, for 20 weeks; lean Zucker rats (LZR) served as controls. Glycemic and renal effects of Cr(pic)3 were determined in the context of indices of oxidative stress and inflammation.
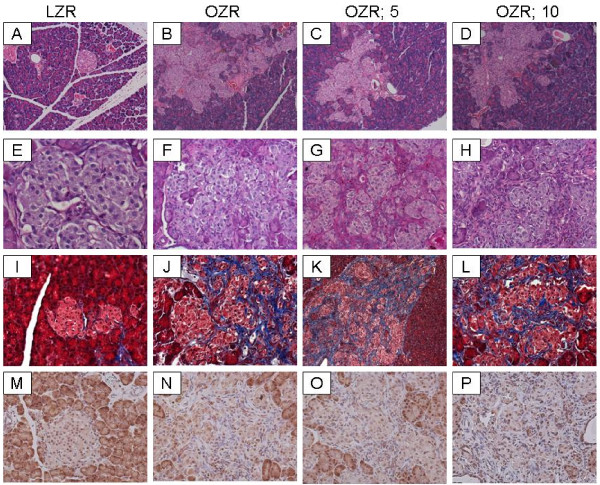
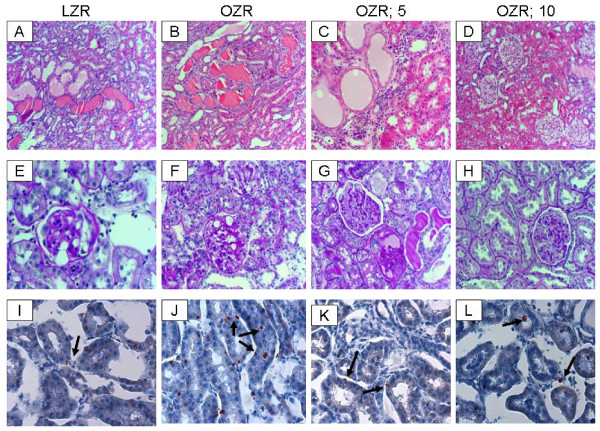
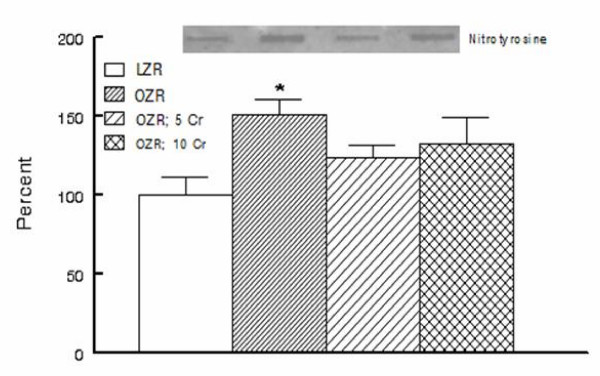
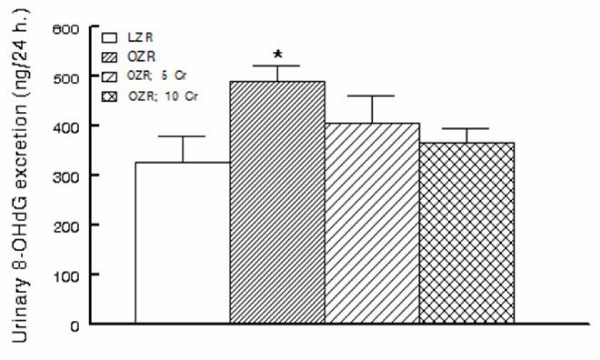
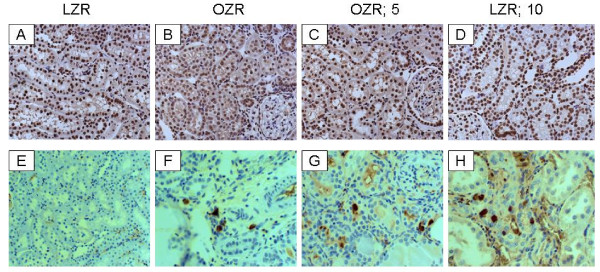
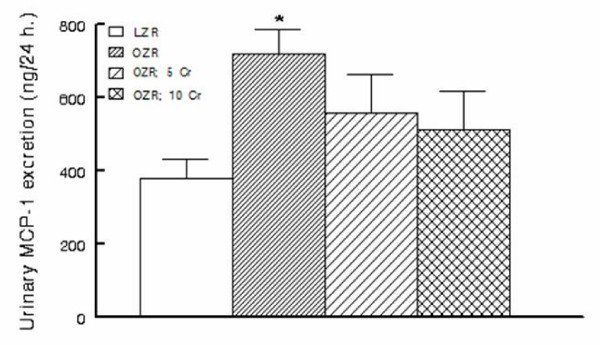
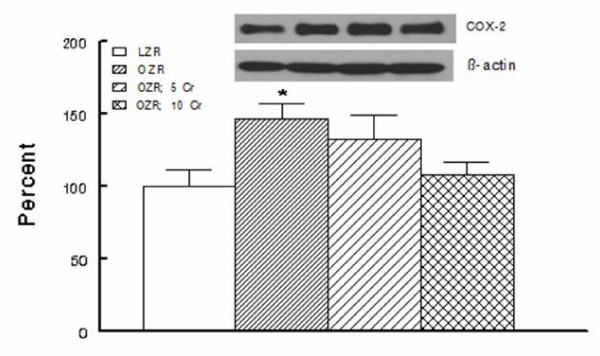
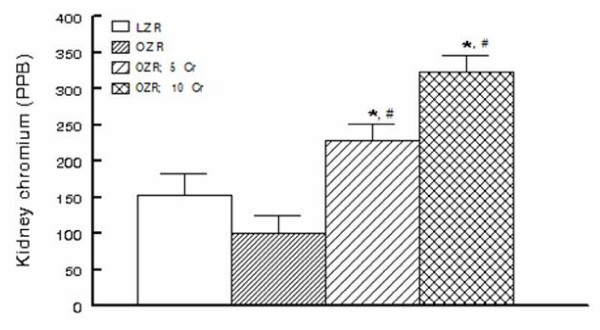
Results: The OZR displayed increased fasting plasma glucose and insulin in association with enlarged pancreatic islets exhibiting collagen and periodic acid Schiff-positive deposits compared to LZR; Cr(pic)3 treatment did not affect these parameters. The OZR, irrespective of Cr(pic)3, excreted more albumin than LZR. Also, other indices of renal function or histopathology were not affected by Cr(pic)3 treatment. Urinary excretion of 8-hydroxydeoxyguanosine (8-OHdG), an index of oxidative DNA damage, was greater in the OZR than LZR; dietary Cr(pic)3 treatment attenuated 8-OHdG excretion. However, immunostaining of kidney for 8-OHdG revealed similar staining pattern and intensity, despite significant renal accumulation of chromium in Cr(pic)3-treated groups. Finally, increased renal nitrotyrosine and cyclooxygenase-2 levels and urinary excretion of monocyte chemoattractant protein-1 of OZR were partially reversed by Cr(pic)3 treatment.
Conclusion: Dietary Cr(pic)3 treatment of OZR does not beneficially influence glycemic status or increase the risk for oxidative DNA damage; rather, the treatment attenuates indices of oxidative stress and inflammation.
Figures
Similar articles
-
Submandibular gland and caries susceptibility in the obese Zucker rat.J Oral Pathol Med. 2011 Feb;40(2):194-200. doi: 10.1111/j.1600-0714.2010.00965.x. Epub 2010 Oct 25. J Oral Pathol Med. 2011. PMID: 20973827 Free PMC article.
-
Renal and glycemic effects of high-dose chromium picolinate in db/db mice: assessment of DNA damage.J Nutr Biochem. 2012 Aug;23(8):977-85. doi: 10.1016/j.jnutbio.2011.05.004. Epub 2011 Sep 29. J Nutr Biochem. 2012. PMID: 21959055 Free PMC article.
-
Effects of chronic chromium picolinate treatment in uninephrectomized rat.Metabolism. 2005 Sep;54(9):1243-9. doi: 10.1016/j.metabol.2005.04.011. Metabolism. 2005. PMID: 16125537
-
The potential value and toxicity of chromium picolinate as a nutritional supplement, weight loss agent and muscle development agent.Sports Med. 2003;33(3):213-30. doi: 10.2165/00007256-200333030-00004. Sports Med. 2003. PMID: 12656641 Review.
-
The Zucker rat model of obesity, insulin resistance, hyperlipidemia, and renal injury.Hypertension. 1992 Jan;19(1 Suppl):I110-5. doi: 10.1161/01.hyp.19.1_suppl.i110. Hypertension. 1992. PMID: 1730447 Review.
Cited by
-
Impact of chromium histidinate on high fat diet induced obesity in rats.Nutr Metab (Lond). 2011 May 3;8:28. doi: 10.1186/1743-7075-8-28. Nutr Metab (Lond). 2011. PMID: 21539728 Free PMC article.
-
Differential effects of taurine treatment and taurine deficiency on the outcome of renal ischemia reperfusion injury.J Biomed Sci. 2010 Aug 24;17 Suppl 1(Suppl 1):S32. doi: 10.1186/1423-0127-17-S1-S32. J Biomed Sci. 2010. PMID: 20804608 Free PMC article.
-
Submandibular gland and caries susceptibility in the obese Zucker rat.J Oral Pathol Med. 2011 Feb;40(2):194-200. doi: 10.1111/j.1600-0714.2010.00965.x. Epub 2010 Oct 25. J Oral Pathol Med. 2011. PMID: 20973827 Free PMC article.
-
Inflammatory cytokines as predictive markers for early detection and progression of diabetic nephropathy.EPMA J. 2010 Mar;1(1):117-29. doi: 10.1007/s13167-010-0004-7. Epub 2010 Mar 13. EPMA J. 2010. PMID: 23199046 Free PMC article.
-
Hepatic oxidative stress, genotoxicity and vascular dysfunction in lean or obese Zucker rats.PLoS One. 2015 Mar 4;10(3):e0118773. doi: 10.1371/journal.pone.0118773. eCollection 2015. PLoS One. 2015. PMID: 25738756 Free PMC article.
References
-
- Friedman JM. Obesity in the new millennium. Nature. 2000;404:632–634. - PubMed
-
- Mozaffari MS, Abdelsayed R, Schaffer SW. Predictive Diagnostics and Personalized Treatment: Dream or Reality. Edited by Golubnitschaja O Nova Publishers; 2009. Pathogenic mechanisms of diabetic complications: Diagnostic biomarkers and prognostic indicators; pp. 157–182.
LinkOut - more resources
Full Text Sources
Research Materials
