. 2009 Dec 10:8:119.
doi: 10.1186/1476-4598-8-119.

CENPA overexpression promotes genome instability in pRb-depleted human cells

Affiliations

CENPA overexpression promotes genome instability in pRb-depleted human cells

Angela Amato et al. Mol Cancer. .

Abstract

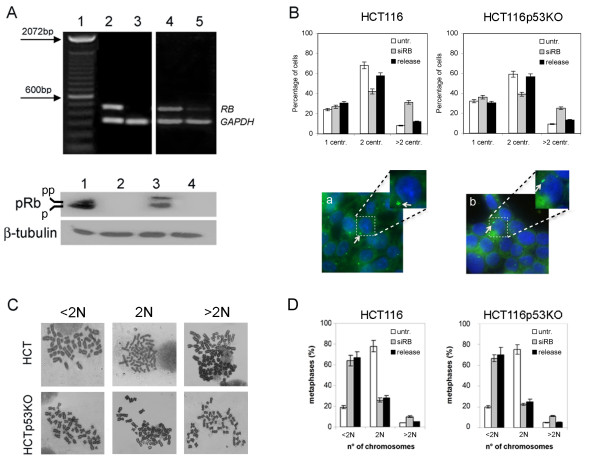
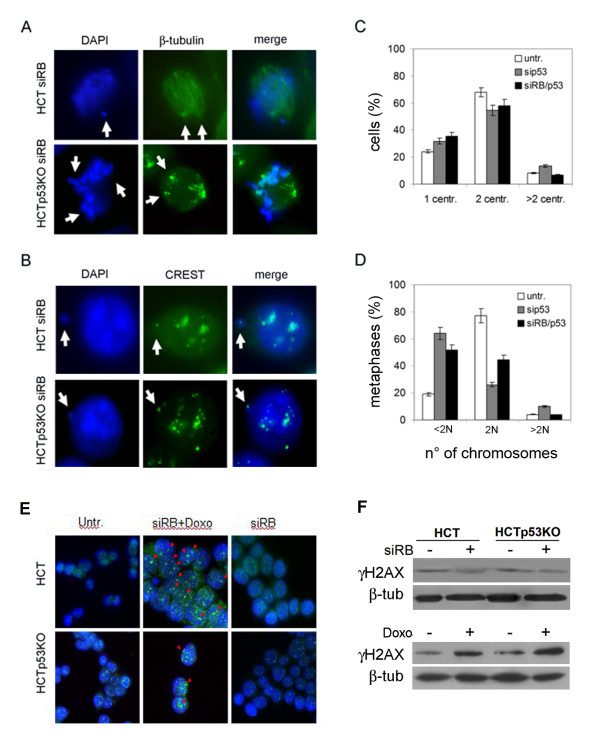
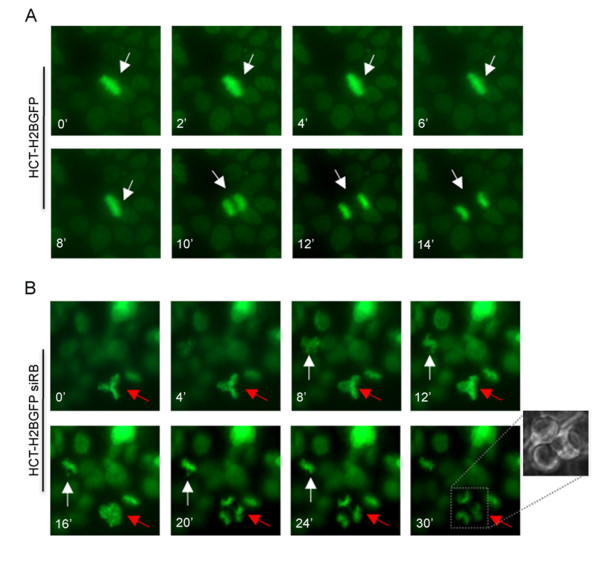
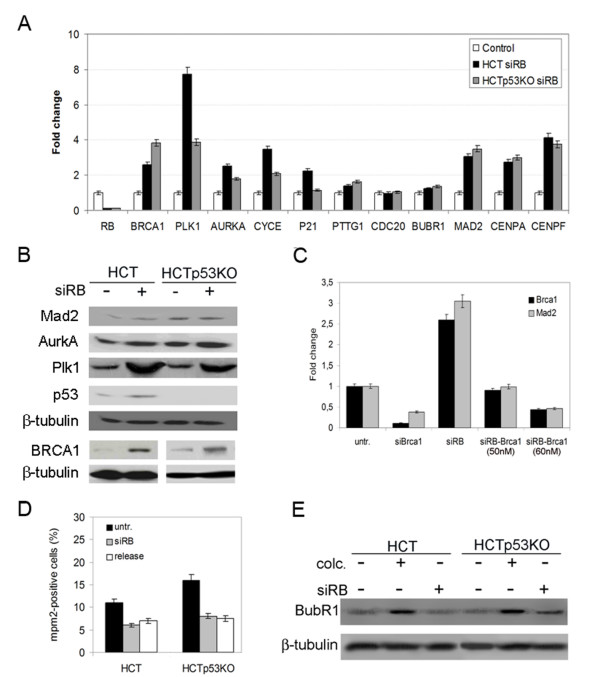
Background: Aneuploidy is a hallmark of most human cancers that arises as a consequence of chromosomal instability and it is frequently associated with centrosome amplification. Functional inactivation of the Retinoblastoma protein (pRb) has been indicated as a cause promoting chromosomal instability as well centrosome amplification. However, the underlying molecular mechanism still remains to be clarified.

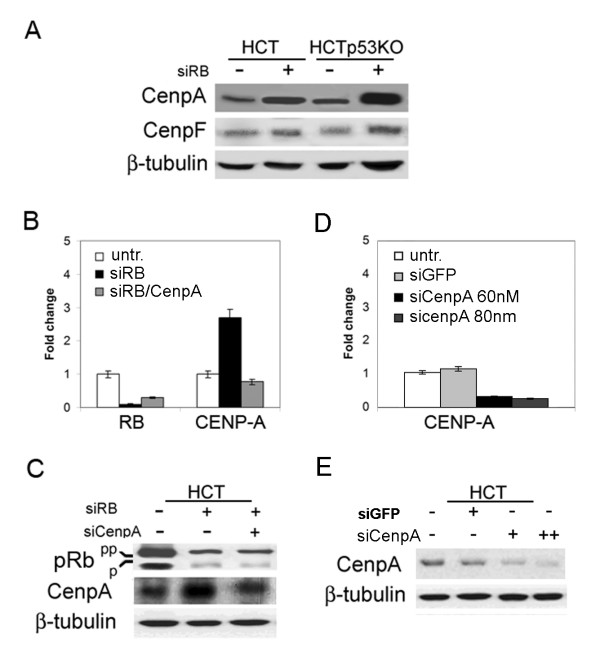
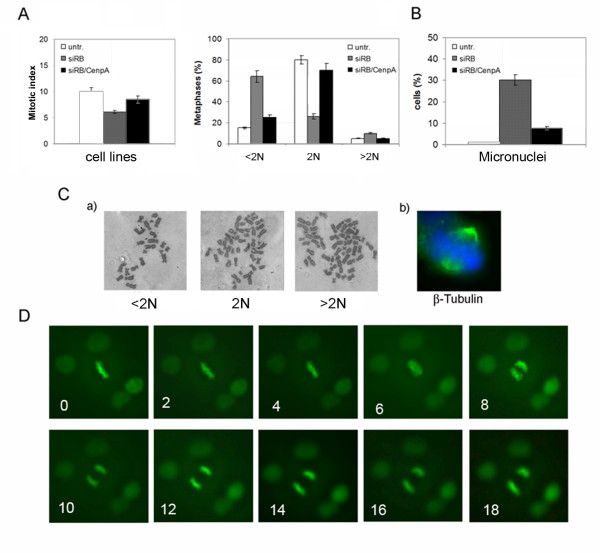
Results: Here we show that pRb depletion both in wild type and p53 knockout HCT116 cells was associated with the presence of multipolar spindles, anaphase bridges, lagging chromosomes and micronuclei harbouring whole chromosomes. In addition aneuploidy caused by pRb acute loss was not affected by p53 loss.Quantitative real-time RT-PCR showed that pRB depletion altered expression of genes involved in centrosome duplication, kinetochore assembly and in the Spindle Assembly Checkpoint (SAC). However, despite MAD2 up-regulation pRb-depleted cells seemed to have a functional SAC since they arrested in mitosis after treatments with mitotic poisons. Moreover pRb-depleted HCT116 cells showed BRCA1 overexpression that seemed responsible for MAD2 up-regulation.Post-transcriptional silencing of CENPA by RNA interference, resulting in CENP-A protein levels similar to those present in control cells greatly reduced aneuploid cell numbers in pRb-depleted cells.

Conclusion: Altogether our findings indicate a novel aspect of pRb acute loss that promotes aneuploidy mainly by inducing CENPA overexpression that in turn might induce micronuclei by affecting the correct attachment of spindle microtubules to kinetochores.


Figures

Figure 1
Figure 1
Supernumerary centrosomes and chromosomal instability promoted by pRb acute loss were not affected by p53 status. A) RT-PCR (top panel) and Western blot (bottom panel) showing RB mRNA and protein levels, respectively, at 72 hours post-transfection in both wild type and p53 knockout HCT116 cells. RT-PCR revealed the presence of RB mRNA in both untransfected cell lines, (lane 2: HCT116-wt, lane 4: HCT116p53KO) but not in RB-depleted cells (lane 3: HCT116-wt, lane 5: HCT116p53KO). Amplification of GAPDH (330 bp) was used as control of the quality of the cDNA. The 100 bp DNA-ladder was loaded in lane 1 as a size marker. Western blot confirmed selective depletion of pRb in siRNA-transfected cells (lane 2: HCT116-wt, lane 4: HCT116p53KO) in comparison with untransfected cells (lane 1: HCT116-wt, lane 3: HCT116p53KO). β-tubulin was used as a loading control. B) Graphs (top panels) showing percentage of cells with 1, 2 or more than 2 (>2) centrosomes in untransfected (untr.), RB-depleted (siRB) and released (release) HCT116-wt and HCT116p53KO. Presence of supernumerary centrosomes (bottom panels, white arrow) detected by γ-tubulin immunostaining (green) in both HCT116-wt and HCT116p53KO cells after pRb acute loss (a, b, respectively). A magnification for each cell type is reported on the right. Nuclei were stained with DAPI (blue). C) Representative pictures of diploid (2N), hypodiploid (<2N) and hyperdiploid (>2N) metaphases in both HCT116-wt and HCT116p53KO pRb-depleted cells. D) Graph summarizing the percentages of diploid (2N), hypodiploid (<2N) and hyperdiploid (>2N) metaphases observed in the indicated cell types transfected with siRNA targeting RB (siRb), untransfected (untr.) and released 10 days (release).
Figure 2
Figure 2
pRb depleted cells overrode mitosis even when chromosome mis-segregation occurred. A) Immunodetection of β-tubulin (green) in pRb depleted cells, wild-type (top) and p53-KO (bottom), showing mitotic defects (white arrows). Nuclei were counterstained with DAPI (blue). B) Centromere immunostaining with a CREST antibody detected the presence of centromeres (green) in micronuclei (white arrow) after pRb acute loss in both HCT116 wild-type (top) and p53-KO (bottom) cells. Nuclei were counterstained with DAPI (blue). C) Graph showing the percentage of HCT116 cells with 1, 2 or more than 2 centrosomes at 72 hours post-transfection of siRNAs targeting p53, alone or in combination with siRNAs targeting RB. D) Graph summarizing the percentages of diploid (2N), hypodiploid (<2N) and hyperdiploid (>2N) metaphases at 72 hours post-transfection of siRNAs targeting p53, alone or in combination with siRNAs targeting RB. p53 depleted (sip53) and pRb/p53 co-depleted (siRB/p53) cells showed a similar increase in the percentage of hypodiploid metaphases in comparison with untransfected cells. E) Immunofluorescence microscopy detecting γ-H2AX foci (green, red arrows) in wild-type (HCT) and p53 knockout (HCTp53KO) pRb-depleted cells after 24 hours of doxorubicin treatment (siRB+Doxo). In contrast, only background signals were detected in untreated RB-depleted (siRB) or untransfected (untr) cells. Nuclei were counterstained with DAPI (blue). F) Western blot analysis did not show increased γ-H2AX levels in HCT and HCTp53KO cells after pRb acute loss (+ siRB) in comparison to untransfected cells (-siRB, top). On the contrary, after doxorubicin (Doxo) treatment γ-H2AX protein levels increased in both cell types (bottom). β-tubulin was used as a loading control.
Figure 3
Figure 3
Chromosome mis-segregation in pRb-depleted cells. A) Time-lapse video-microscopy done in mitotic HCT116 cells expressing the H2B-GFP gene. Images showing that wild type cells normally progress in mitosis segregating chromosome in two daughter cells. B) RB-depleted cells showing metaphases with unaligned chromosomes that segregate incorrectly generating micronuclei (white arrow) or tripolar metaphases dividing into three daughter cells (red arrow).
Figure 4
Figure 4
pRb acute loss induced differential expression of several centrosome and mitotic genes. A) Real-time RT-PCR showed increased expression levels of genes involved in centrosome duplication (PLK1, AURKA, and CYCE), as well in the SAC and mitosis (BRCA1, PTTG1, CDC20, BUBR1, MAD2, CENPA, and CENPF) after pRb acute loss in both HCT116wt (HCT) and p53-knockout (HCTp53KO) cells. The x-axis indicates the genes and the y-axis the relative quantification in pRb-depleted cells in respect to the gene expression level in control cells, (untransfected HCT116wt and HCT116p53KO were used as calibrator). B) Western blot showing Mad2, AurkA, Plk1, p53 and BRCA1 protein levels in HCT116 cells both wild-type (HCT, lane 1) and p53-knockout (HCTp53KO, lane 3) and after pRb acute loss (siRB+, lane 2 and lane 4 respectively). β-tubulin was used as a loading control. C) Real-time RT-PCR showing that changes in MAD2 transcript depended on BRCA1 gene expression levels. BRCA1 transcripts were reduced more than 80% at 72 hours post-transfection of siRNAs targeting BRCA1 (siBrca1 60 nM). Modulation of BRCA1 transcript levels in RB-depleted cells using different siRNA concentration (50 nM and 60 nM) reduced MAD2 expression accordingly. D) Graph showing mitotic indices in both wild type and p53-knockout HCT116 cells after pRb acute loss (siRB) and in released cells in comparison with untransfected cells (untr). E) Western blot showing similar BubR1 protein levels in untransfected cells (lanes 1 and 4) and in RB depleted cells (lanes 3 and 6). As expected HCT116 and HCTp53KO cell types after colcemid treatment (lanes 2 and 5) showed increase in BubR1 protein levels.
Figure 5
Figure 5
Reduction of CENPA overexpression by RNAi in pRb depleted cells. A) Western blot showing CENP-A and CENP-F protein levels in HCT116 cells, wild type (HCT, lane 1), p53-knockout (HCTp53KO, lane 3) and after pRb acute loss (siRB+, lanes 2 and 4), β-tubulin was used as a loading control. B) Real-time RT-PCR showed CENPA decreased transcript levels after simultaneous RB/CENPA post-transcriptional silencing (siRB/CenpA), in comparison to CENPA expression in RB-depleted cells (siRB). RB transcripts were reduced in both pRb- and pRb/CenpA- depleted cells. Untransfected HCT116 cells were used as a calibrator. C) Western blot showing reduction of CENP-A protein levels, in comparison to CENPA expression in RB-depleted cells (siRB+), in cells simultaneously transfected with siRNAs specific for both RB and CENPA (lane 3). Protein extracts of HCT116 wild type and pRb-depleted cells were loaded in lanes 1 and 2 respectively. β-tubulin was used as a loading control. D) Real-time RT-PCR showing CENPA transcript levels in HCT116 cells transfected with a control siRNA targeting GFP (siGFP) and after transfection of siRNAs targeting CENPA (two different doses siCenpA 60 nM, siCenpA 80 nM). E) Western blot showing reduction of CENP-A protein levels after CenpA post-transcriptional silencing (lane 3: 60 nM, lane 4: 80 nM). Normal levels of CENPA were present in untransfected cells (lane 1) and in cells transfected with a control siRNA (lane 2: siGFP).
Figure 6
Figure 6
Inhibition of genomic instability by restoring the correct CenpA protein level in RB-depleted cells. A) Detection of Mpm2 positive cells by immunofluorescence microscopy in pRb and CenpA co-depleted cells showed a mitotic index (left panel) close to that of wild-type cells. Graph showing (right panel) a large reduction in the percentage of hypodiploid mitosis (<2N) in pRb/CENP-A co-depleted cells (siRB/CenpA) in comparison with pRb depleted cells (siRB). B) Graph showing reduction of cells with micronuclei in pRb/CENP-A co-depleted cells (siRB/CenpA) in comparison with pRb alone depleted cells (siRB). C) a- Examples of near diploid (2N), hypodiploid (<2N) and hyperdiploid (>2N) metaphases in pRb/CenpA co-depleted cells; b- β-tubulin (green) immunostaining revealed the presence of normal bipolar spindles in pRb/CENP-A co-depleted cells. Chromosomes were counterstained with DAPI (blue). D) Time-lapse video-microscopy of mitotic pRb/CenpA double knockdown cells expressing the H2B-GFP construct showing that they progress normally into mitosis.

Similar articles

Cited by

References

    1. Rajagopalan H, Lengauer C. Aneuploidy and cancer. Nature. 2004;432:338–341. doi: 10.1038/nature03099. - DOI - PubMed
    1. Pellman D. Cell biology: aneuploidy and cancer. Nature. 2007;446:38–39. doi: 10.1038/446038a. - DOI - PubMed
    1. Weaver BA, Cleveland DW. Does aneuploidy cause cancer? Curr Opin Cell Biol. 2006;18:658–667. doi: 10.1016/j.ceb.2006.10.002. - DOI - PubMed
    1. Kops GJ, Weaver BA, Cleveland DW. On the road to cancer: aneuploidy and the mitotic checkpoint. Nat Rev Cancer. 2005;5:773–785. doi: 10.1038/nrc1714. - DOI - PubMed
    1. Gimenez-Abian JF, Diaz-Martinez LA, Wirth KG, Andrews CA, Gimenez-Martin G, Clarke DJ. Regulated separation of sister centromeres depends on the spindle assembly checkpoint but not on the anaphase promoting complex/cyclosome. Cell Cycle. 2005;4:1561–1575. - PubMed

Publication types