. 2009 Dec 10;28(1):150.
doi: 10.1186/1756-9966-28-150.

The effects of HIF-1alpha on gene expression profiles of NCI-H446 human small cell lung cancer cells

Affiliations

The effects of HIF-1alpha on gene expression profiles of NCI-H446 human small cell lung cancer cells

Jun Wan et al. J Exp Clin Cancer Res. .

Abstract

Background: Gene targeted therapy refers to any therapy focused on one of the many biological features of the tumor. Such features are mediated by specific genes that are involved in tumor metastasis, recurrence, poor response to chemotherapy and others. Hypoxia is an important pathognomonic feature of many malignant tumors including SCLC (small cell lung cancer). HIF-1alpha, which is induced by hypoxia, is the most important regulatory factor of many specific genes that can influence the biological features of tumors.

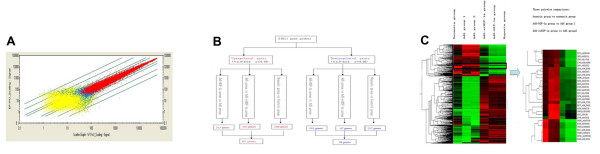
Methods: In this study, we tried to elucidate the changes in gene expression profiles of SCLC NCI-H446 cells mediated by HIF-1alpha. According to different treatments of cells, three experimental pairwise comparisons were designed: hypoxia group vs. control group, Ad5-HIF-1alpha group vs. Ad5 group, and Ad5-siHIF-1 alpha group Vs Ad5 group.

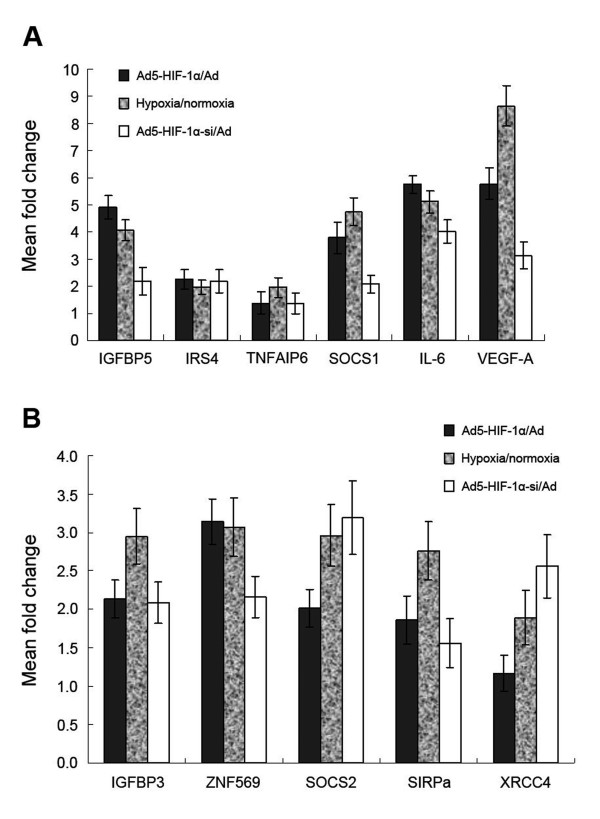
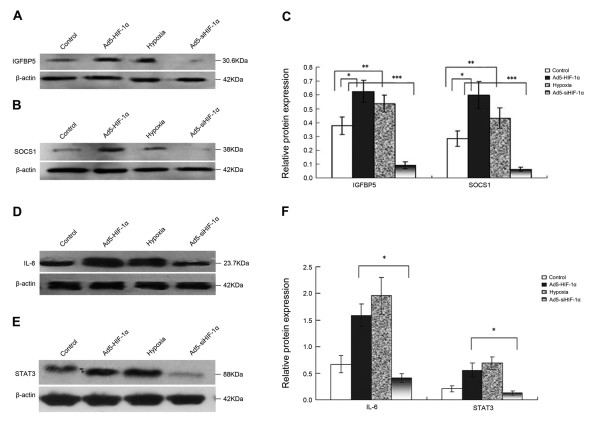
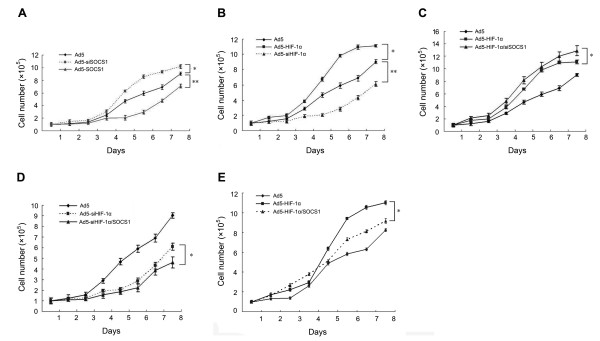
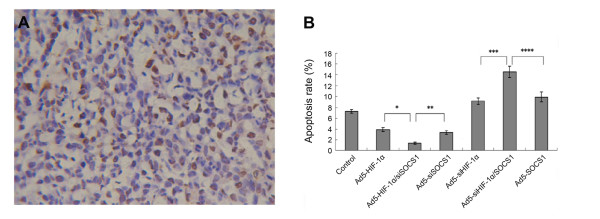
Results: Results from the analysis of gene expression profiles indicated that there were 65 genes upregulated and 28 genes downregulated more than two-fold in all three experimental pairwise comparisons. These genes were involved in transport, signal-transduction, cell adhesion/motility, growth factor/cytokines, transcription, inflammatory response, metabolic process, in addition to others. SOCS1, IGFBP5, IL-6 and STAT3 were also upregulated at protein level. SOCS1 could significantly induce apoptosis and suppress growth of NCI-H446 cells but HIF-1alpha could induce growth and suppress apoptosis.

Conclusions: Through this research, we are trying to find novel functional genes that are mediated by HIF-1alpha and provide the theoretical basis for new therapeutic targets. HIF-1 alpha maybe upregulate the expression of SOCS1 through mediation of STAT3 and IL-6. In addition, SOCS1 could significantly induce apoptosis and suppress growth of NCI-H446 cells. This was contrary to HIF-1alpha and it indicated that there might be an antagonism effect between HIF-1alpha and SOCS1 on regulating growth and apoptosis of NCI-H446 cells.


Figures

Figure 1
Figure 1
Microarray and data analysis (A) Scatter graph of gene chip scanning signals: Scatter plot of the normalized microarray datasets resulting from analysis of human SCLC NCI-H446 cells. All 54,614 gene probes are represented in this plot. (B) Experimental design and summary of results: Text in red indicates the total number of genes upregulated in 3 experimental conditions (Ad5-HIF-1alpha vs. Ad5; Ad5 vs. Ad5-siHIF-1alpha; hypoxia vs. control-normoxia). Text in blue indicates the total number of genes downregulated in 3 experimental conditions (same as above). Finally, 65 genes were upregulated and 28 genes were downregulated in all 3 pairwise comparisons. (C) Hierarchical clustering analysis of gene expression profiles of three pairwise comparisons (Ad5-siHIF-1alpha group vs. Ad5 group1, Ad5-HIF-1alpha group vs. Ad5 group2, hypoxia group vs. normoxia group). The normalization of all the data of genes with differential expression was handled by clustering analysis using software Gene Spring 7.0. The graph of clustering analysis on the right side is the magnification about the local region (as marked by black border) of the total clustering analysis.
Figure 2
Figure 2
Real-time PCR analysis of upregulated or downregulated gene expression in response to HIF-1alpha (A) Aliquots of the same RNA preparations used for microarray hybridization were analyzed by quantitative real-time PCR. In three pairwise comparisons, the upregulation-folds of IGFBP5, IRS4, TNFAIP6, SOCS1, IL-6, VEGF-A mRNA expression were calculated. The mean and standard error are shown (p < 0.05). (B) Aliquots of the same RNA preparations used for microarray hybridization were analyzed by quantitative real-time PCR. In three pairwise comparisons, the downregulation-folds of IGFBP3, ZNF569, SOCS2, SIRPa and XRCC4 mRNA were calculated. The mean and standard error are shown (p < 0.05).
Figure 3
Figure 3
Western blot analysis of regulation of protein expression by HIF-1alpha in NCI-H446 cells. According to different treatments, all the cells were divided into four groups: control group (the cells cultured under normoxic conditions of 20% O2), Ad5-HIF-1alpha transfection group, hypoxia group (the cells cultured under normoxic conditions of 1% O2) and Ad5-siHIF-1alpha transfection group (after transfection, the cells were cultured under normoxic conditions of 1% O2). (A) Western blot analysis for IGFBP5 protein expressed by the cells of four groups. (B) Western blot analysis for SOCS1 protein expressed by the cells of four groups. (C) Densitometric analysis of the IGFBP5 and SOCS1 bands compared to the corresponding β-actin bands (*p < 0.05 expression of IGFBP5 or SOCS1 protein in Ad5-HIF-1alpha group vs. control group; ** p < 0.05 expression of IGFBP5 or SOCS1 protein in hypoxia group vs. control group; *** p < 0.05 expression of IGFBP5 or SOCS1 protein in Ad5-siHIF-1alpha group vs. control group). (D) Western blot analysis for IL-6 protein expressed by the cells of four groups. (E) Western blot analysis for STAT3 protein expressed by the cells of four groups. (F) Densitometric analysis of the IL-6 and STAT3 bands compared to the corresponding β-actin bands (*p < 0.05 expression of IL-6 or STAT3 protein in Ad5-HIF-1alpha group vs. Ad5-siHIF-1alpha group group.)
Figure 4
Figure 4
Effect of HIF-1alpha and SOCS1 on cell growth was measured by cell counting. (A) After transfection with Ad5-SOCS1, the growth of cells was slowed but promoted after transfection with Ad5-siSOCS1(*p < 0.05 Ad5-siSOCS1 group vs. Ad5 group; **p < 0.01 Ad5-SOCS1 group vs. Ad5 group) (B) After transfection with Ad5- HIF-1alpha, the growth of cells was promoted but slowed after transfection with Ad5- siHIF-1alpha (*p < 0.01 Ad5-HIF-1alpha group vs. Ad5 group; **p < 0.01 Ad5-si HIF-1alpha group vs. Ad5 group). (C) In the Ad5-HIF-1alpha group, the growth of cells was promoted after blockade of SOCS1 by Ad5-siSOCS1 (*p < 0.01 Ad5- HIF-1alpha/siSOCS1 group vs. Ad5-HIF-1alpha group). (D) In the Ad5-si HIF-1alpha group, the growth of cells was slowed after co-transfection with SOCS1 (*p < 0.05 Ad5-siHIF-1alpha/SOCS1 group vs. Ad5-siHIF-1alpha group). (E) In the Ad5-HIF-1alpha group, the growth of cells was slowed from day 5 to day 8 as the growth curve moved right after co-transfection with SOCS1 (*p < 0.05 Ad5-HIF-1alpha group vs. Ad5-HIF-1alpha/SOCS1 group).
Figure 5
Figure 5
We used the tunel stain to investigate the effect of HIF-1alpha and SOCS1 on cell apoptosis and the apoptosis rate was calculated in all the experimental groups. (A) The background was clear and the apoptotic NCI-H446 nucleuses were stained yellow and normal nucleuses were stain blue(tunel stain × 400) (B) The effect of HIF-1alpha and SOCS1 on apoptosis of SCLC cells after transfection for 8 d (*p < 0.05 Ad5-HIF-1alpha/siSOCS1 group vs. Ad5-HIF-1alpha group; **p < 0.05 Ad5-HIF-1alpha/siSOCS1 group vs. Ad5-siSOCS1 group; ***p < 0.01 Ad5-si HIF-1alpha/SOCS1 group vs. Ad5-siHIF-1alpha group; ****p < 0.05 Ad5-si HIF-1alpha/SOCS1 group vs. Ad5-SOCS1 group).

Similar articles

Cited by

References

    1. Vaupel P, Kallinowski F, Okunieff P. Blood flow, oxygen and nutrient supply, and metabolic microenvironment of human tumors: a review. Cancer Res. 1989;49:6449–6465. - PubMed
    1. Fan LF, Diao LM. Effect of Hypoxia Induced Factor-1a on the Growth of A549 lung cancer cells. J Pract Med. 2007;23:451–453.
    1. Semenza GL, Wang GL. A nuclear factor induced by hypoxia via de novo protein synthesis binds to the human erythropoietin gene enhancer at a site required for transcriptional activation. Mol Cell Biol. 1992;12:5447–5454. - PMC - PubMed
    1. Wang GL, Jiang BH, Rue EA, Semenza GL. Hypoxia-inducible factor 1 is a basic-helix-loop-helix-PAS heterodimer regulated by cellular O2 tension. Proc Natl Acad Sci USA. 1995;92:5510–5514. - PMC - PubMed
    1. Maxwell PH, Pugh CW, Ratcliffe PJ. Activation of the HIF pathway in cancer. Curr Opin Genet Dev. 2001;11:293–299. - PubMed

Publication types

MeSH terms

Substances