. 2009 Dec 11:4:44.
doi: 10.1186/1749-8104-4-44.

Postembryonic development of transit amplifying neuroblast lineages in the Drosophila brain

Affiliations

Postembryonic development of transit amplifying neuroblast lineages in the Drosophila brain

Natalya Izergina et al. Neural Dev. .

Abstract

Background: Specific dorsomedial (DM) neuroblast lineages of the Drosophila brain amplify their proliferation through generation of transit amplifying intermediate progenitor cells. Together, these DM neuroblast lineages comprise over 5,000 adult-specific neural cells and thus represent a substantial part of the brain. However, no information is currently available about the structure or function of any of the neural cells in these DM lineages. In this report we use MARCM-based clonal analysis together with immunocytochemical labeling techniques to investigate the type and fate of neural cells generated in the DM lineages.

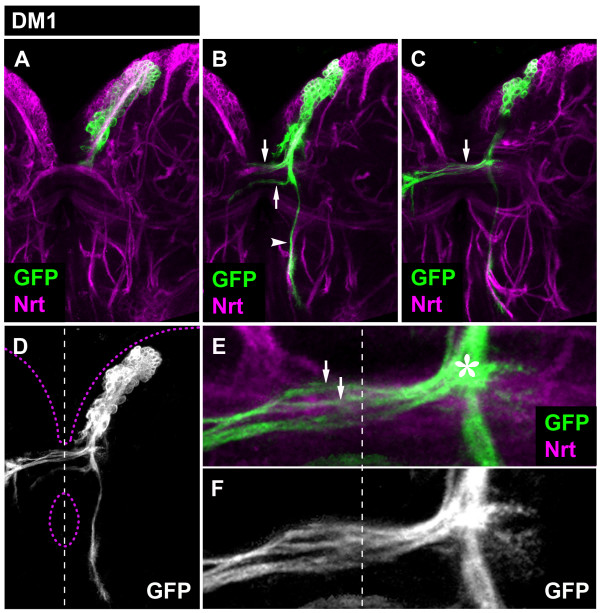
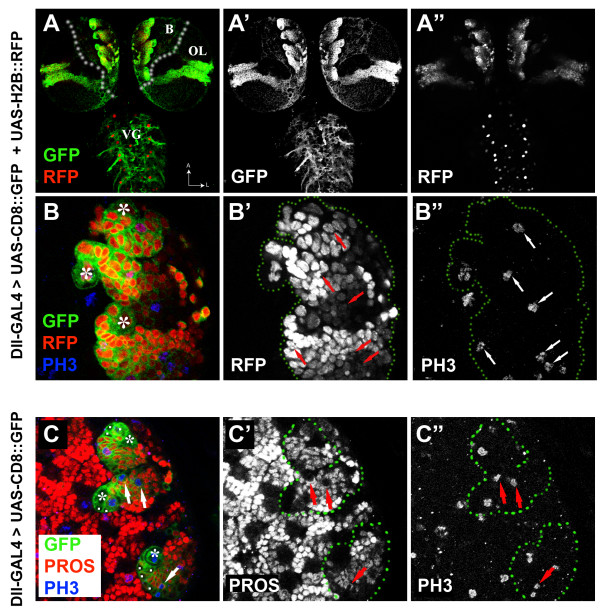
Results: Genetic cell lineage-tracing and immunocytochemical marker analysis reveal that DM neuroblasts are multipotent progenitors that produce a set of postembryonic brain glia as well as a large number of adult-specific protocerebral neurons. During larval development the adult-specific neurons of each DM lineage form several spatially separated axonal fascicles, some of which project along larval brain commissural structures that are primordia of midline neuropile. By taking advantage of a specific Gal4 reporter line, the DM-derived neuronal cells can be identified and followed into early pupal stages. During pupal development the neurons of the DM lineages arborize in many parts of the brain and contribute to neuropile substructures of the developing central complex, such as the fan-shaped body, noduli and protocerebral bridge.

Conclusions: Our findings provide cellular and molecular evidence for the fact that DM neuroblasts are multipotent progenitors; thus, they represent the first identified progenitor cells in the fly brain that have neuroglioblast functions during postembryonic development. Moreover, our results demonstrate that the adult-specific neurons of the DM lineages arborize widely in the brain and also make a major contribution to the developing central complex. These findings suggest that the amplification of proliferation that characterizes DM lineages may be an important requirement for generating the large number of neurons required in highly complex neuropile structures such as the central complex in the Drosophila brain.


Figures

Figure 1
Figure 1
DM neuroblast lineages contain both neurons and glial cells. (A, B) Consecutive confocal images (from dorsal to ventral) of a DM MARCM clone (GFP, green). Neuronal cells are Elav-positive and glial cells are Repo-positive (blue, arrowheads). (C) Scheme of the DM lineage: note that localization of the glial cells is distal to the neuroblast in the clone. (D) A close-up view of the DM glial cells. Secondary neuronal cells, their projections and common axonal bundle are stained with anti-Neurotactin (Nrt, red) and glial cells are Repo-positive (blue). Glial cells extend processes along the axonal bundle (asterisk).
Figure 2
Figure 2
Projection pattern of the larval DM1 lineage. (A-C) Consecutive confocal images (from dorsal to ventral) of DM1 MARCM-labeled clone (GFP, green). Secondary neurons and their projections are stained with anti-Neurotactin (Nrt, magenta). Note commissural (arrows) and longitudinal (arrowheads) projections. (D) Z-projection of the entire DM1 lineage. Brain and oesophagus outline shown as a magenta dashed line; midline is a white dashed line. (E, F) A close-up view of the commissural projections. Note how the axonal bundle defasciculates (arrows) upon entering the commissure and that a subset of these axons enters the contralateral brain hemisphere. Also note that DM1 axons enter the commissure at a most medial site (asterisk).
Figure 3
Figure 3
Projection pattern of the larval DM2 lineage. (A-C) Consecutive confocal images (from dorsal to ventral) of DM2 MARCM-labeled clone (GFP, green). Secondary neurons and their projections are stained with anti-Neurotactin (Nrt, magenta). Note commissural (arrows) and longitudinal (arrowheads) projections. (D) Z-projection of the entire DM2 lineage. Brain and oesophagus outline shown as a magenta dashed line; midline is a white dashed line. (E, F) A close-up view of the commissural projections. Note how the axonal bundle defasciculates (arrows) upon entering the commissure and that a subset of these axons enters the contralateral brain hemisphere. Also note the site where DM2 axons enter the commissure (asterisk).
Figure 4
Figure 4
Projection pattern of the larval DM3 lineage. (A-C) Consecutive confocal images (from dorsal to ventral) of DM3 MARCM-labeled clone (GFP, green). Secondary neurons and their projections are stained with anti-Neurotactin (Nrt, magenta). Note commissural (arrows) and longitudinal (arrowheads) projections. (D) Z-projection of the entire DM3 lineage. Brain and oesophagus outline shown as a magenta dashed line; midline is a white dashed line. (E, F) A close-up view of the commissural projections. Note how the axonal bundle defasciculates (arrows) upon entering the commissure and that a subset of these axons enters the contralateral brain hemisphere. Also note the site where DM3 axons enter the commissure (asterisk).
Figure 5
Figure 5
Projection pattern of the larval DM4 lineage. (A-C) Consecutive confocal images (from dorsal to ventral) of DM4 MARCM-labeled clone (GFP, green). Secondary neurons and their projections are stained with anti-Neurotactin (Nrt, magenta). Note commissural (arrows) and longitudinal (arrowheads) projections. (D) Z-projection of the entire DM4 lineage. Brain and oesophagus outline shown as a magenta dashed line; midline is a white dashed line. (E, F) A close-up view of the commissural projections. Note the site where DM4 axons enter the commissure (asterisk). Although not visible in this figure, a subset of the commissural axons enters the contralateral brain hemisphere.
Figure 6
Figure 6
Projection pattern of the larval DM5 lineage. (A-C) Consecutive confocal images (from dorsal to ventral) of DM5 MARCM-labeled clone (GFP, green). Secondary neurons and their projections are stained with anti-Neurotactin (Nrt, magenta). Note commissural (arrows) and longitudinal (arrowheads) projections. (D) Z-projection of the entire DM5 lineage. Brain and oesophagus outline shown as a magenta dashed line; midline is a white dashed line. (E, F) A close-up view of the commissural projections. Note the site where DM5 axons enter the commissure (asterisk). Although not visible in this figure, a subset of the commissural axons enters the contralateral brain hemisphere.
Figure 7
Figure 7
Projection pattern of the larval DM6 lineage. (A-C) Consecutive confocal images (from dorsal to ventral) of DM6 MARCM-labeled clone (GFP, green). Secondary neurons and their projections are stained with anti-Neurotactin (Nrt, magenta). Note commissural (arrows) and longitudinal (arrowheads) projections. (D) Z-projection of the entire DM6 lineage. Brain and oesophagus outline is shown as a magenta dashed line; midline is the white dashed line. (E, F) A close-up view of the commissural projections. Note the site where DM6 axons enter the commissure (asterisk). Although not visible in this figure, a subset of the commissural axons enters the contralateral brain hemisphere.
Figure 8
Figure 8
Specific labeling of DM lineages by Dll-Gal4. Confocal images of third instar larval nervous system expressing mCD8::GFP (green) and H2B::RFP (red in A, B) under the control of Dll-GAL4 and immunostained with anti phospho-histone 3 (PH3, blue) and anti-prospero (PROS, red in C). Panels in the left column show merged views of individual channels presented in grey scale in the middle and right columns for clarity. Green dotted lines indicate the contours of the GFP-labeled domains. (A-A") Dorsal view of a larval central nervous system at low magnification reveals restricted expression of the reporter genes in the medial part of the brain hemispheres (B) in the optic lobes (OL) and a few cells in the ventral ganglia (VG). (B-B") Higher magnification of the dorsomedial area in the left brain hemisphere. Shown are three DM neuroblasts (asterisks) and their closely associated progeny cells. Scattered cells undergoing mitosis are observed throughout the cell clusters (arrows). (C-C") Three DM lineages marked by Dll-GAL4 expression lack expression of Prospero in the neuroblasts and their surrounding daughter IP cells (C; asterisks and white dots, respectively). IP cells undergoing mitosis (arrows) are marked by PH3 staining (C"; arrows). They show a crescent localization of prospero (C'; arrows) in contrast to the nuclear localization of the protein in most post-mitotic cells visible in the field.
Figure 9
Figure 9
Example of a first DM lineage projection pattern in the pupal brain 24 hours after puparium formation. (A-C) Consecutive Z-projections prepared from transverse confocal sections of pupal brain neuropile. Panels show both brain hemispheres: (A) is the most dorsal, and (C) the most ventral section, with the midline in the center and anterior part pointing up (neuraxis). DM MARCM clone is labeled with anti-GFP (green); brain neuropile is labeled with anti-nc82 (magenta). Note the contralateral (arrows) and ipsilateral (arrowheads) projections. (D) A close-up view of the ipsilateral arborization in the posterior part of the brain. (E, F) A close-up view of the projections into the developing fan-shaped body and the contralateral nodulus. Note two major fascicles and one minor fascicle (arrows) entering the fan-shaped body and forming columnar arborizations. Dashed lines indicate the outlines of fan-shaped body and noduli.
Figure 10
Figure 10
Example of a second DM lineage projection pattern in the pupal brain 24 hours after puparium formation. (A-C) Consecutive Z-projections prepared from transverse confocal sections of pupal brain neuropile. Panels show both brain hemispheres; (A) is the most dorsal, and (C) the most ventral section, with the midline in the center and anterior part pointing up (neuraxis). DM MARCM clone is labeled with anti-GFP (green); brain neuropile is labeled with anti-nc82 (magenta). Note the contralateral (arrows) and ipsilateral (arrowheads) projections. (D) A close-up view of the major ipsilateral arborization. (E, F) A close-up view of the projections into the developing fan-shaped body and contralateral nodulus. Note two fascicles (arrowheads in (F)) entering the fan-shaped body and forming columnar arborizations. Also note the arborization formed in the contralateral nodulus (arrow in (F)). Dashed lines indicate the outlines of the fan-shaped body and noduli.

Similar articles

Cited by

References

    1. Urbach R, Technau GM. Neuroblast formation and patterning during early brain development in Drosophila. Bioessays. 2004;26:739–751. - PubMed
    1. Hartenstein V, Spindler S, Pereanu W, Fung S. The development of the Drosophila larval brain. Adv Exp Med Biol. 2008;628:1–31. - PubMed
    1. Skeath JB, Thor S. Genetic control of Drosophila nerve cord development. Curr Opin Neurobiol. 2003;13:8–15. - PubMed
    1. Egger B, Chell JM, Brand AH. Insights into neural stem cell biology from flies. Philos Trans R Soc Lond B Biol Sci. 2008;363:39–56. - PMC - PubMed
    1. Technau GM, Berger C, Urbach R. Generation of cell diversity and segmental pattern in the embryonic central nervous system of Drosophila. Dev Dyn. 2006;235:861–869. - PubMed

Publication types

MeSH terms

LinkOut - more resources