. 2009 Dec 14:7:86.
doi: 10.1186/1741-7007-7-86.

Characterization of the histone H2A.Z-1 and H2A.Z-2 isoforms in vertebrates

Affiliations

Characterization of the histone H2A.Z-1 and H2A.Z-2 isoforms in vertebrates

Deanna Dryhurst et al. BMC Biol. .

Abstract

Background: Within chromatin, the histone variant H2A.Z plays a role in many diverse nuclear processes including transcription, preventing the spread of heterochromatin and epigenetic transcriptional memory. The molecular mechanisms of how H2A.Z mediates its effects are not entirely understood. However, it is now known that H2A.Z has two protein isoforms in vertebrates, H2A.Z-1 and H2A.Z-2, which are encoded by separate genes and differ by 3 amino acid residues.

Results: We report that H2A.Z-1 and H2A.Z-2 are expressed across a wide range of human tissues, they are both acetylated at lysine residues within the N-terminal region and they exhibit similar, but nonidentical, distributions within chromatin. Our results suggest that H2A.Z-2 preferentially associates with H3 trimethylated at lysine 4 compared to H2A.Z-1. The phylogenetic analysis of the promoter regions of H2A.Z-1 and H2A.Z-2 indicate that they have evolved separately during vertebrate evolution.

Conclusions: Our biochemical, gene expression, and phylogenetic data suggest that the H2A.Z-1 and H2A.Z-2 variants function similarly yet they may have acquired a degree of functional independence.


Figures

Figure 1
Figure 1
(A) Mass spectrometry (MS/MS) spectrum of the N-terminal H2A.Z-2 peptide, AGGKAGKDSGKAKAKAVSR. The peptide is modified with three acetyl groups on lysines 4, 7, and 11. (B) MS/MS spectrum of the triply-acetylated N-terminal peptide, AGGKAGKDSGKTKTKAVSR, of H2A.Z-1. The acetyl groups were again identified on lysines 4, 7, and 11. The precursor ions selected for dissociation were the [M+2H]+2 ions, and are m/z 1041.1 (A) and m/z 1071.1 (B), respectively. The amino acid sequences are shown above the spectra, and the masses above and below the sequences correspond to the theoretical b- and y-type product ions. The masses provided are the monoisotopic, nominal masses of the product ions. The observed, singly-protonated b- and y-type ions are underlined and are assigned to their corresponding m/z peaks in the spectra. The observed, doubly-protonated ions are denoted with asterisks. The acetylated lysines (K4, K7, and K11) are indicated with 'ac'. The unacetylated amino groups were derivatized with propionic anhydride and are denoted with 'pr'. (C) Selected ion chromatograms (SICs) for the N-terminal peptides of H2A.Z-2 and H2A.Z-1. The theoretical m/z values of the [M+2H]+2 and [M+3H]+3 ions for each peptide were used to generate the SICs and these values are adjacent to each chromatogram. Note that the retention time decreases with increasing number of acetyl groups due to the loss of propionylated lysine. The ion count intensities for each SIC are located on the y-axis and are provided on the left adjacent to each chromatogram.
Figure 2
Figure 2
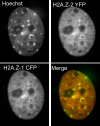
Fluorescence microscopy of H2A.Z-1 and H2A.Z-2 variants in mouse embryonic fibroblasts. A mouse embryonic fibroblast nucleus is shown following transfection with H2A.Z-2-YFP and H2A.Z-1-cyan fluorescent protein (CFP) and imaged live. The top left panel shows cells stained with DNA binding dye Hoechst 33342. The top right panel shows the distribution of H2A.Z-2-yellow fluorescent protein (YFP). The bottom left panel shows the distribution of H2A.Z-1-CFP while the composite image shows the Hoechst staining (green) relative to the distribution of H2A.Z-2-YFP. Sites that are enriched in H2A.Z-2 are orange and are predominantly euchromatin. The chromocenters appear yellow, indicating the presence of both DNA and H2A.Z-2-YFP.
Figure 3
Figure 3
Distribution of H2A.Z-2 and H2A.Z-1 within chromatin fractions. (A) S1, SE and P chromatin fractions were generated from HEK 293 cells stably expressing Flag epitope tagged H2A.Z-2 and H2A.Z-1, resolved by sodium dodecyl sulphate-PAGE and analysed by Western blot. The antibodies used for Western blotting are indicated on the right. The anti-H2A.Z antibody recognizes both isoforms in their endogenous (arrow 1) and Flag-tagged (arrow 2) forms. Probing with the anti-H3 Tri Me K4 antibody indicates that this modification is more enriched within the P fraction and therefore does not partition equally among the fractions. Total histone H4 was used as a loading control and CM indicates chicken erythrocyte histone marker. The trends seen were consistent across multiple experimental replicates. (B) 4% native acrylamide gel of purified DNA from the S1, SE and P chromatin fractions used in A. The S1 fraction contains mononucleosomes (M) with approximate DNA length 150 bp, while the SE and P fractions contain chromatin composed of mononucleosomes, dinucleosomes (Di), trinucleosomes (Tri), tetranucleosomes (Te) and longer chromatin. M is CFO-1 cut pBR322 DNA marker.
Figure 4
Figure 4
Immunoprecipitation of H2A.Z-2- and H2A.Z-1-containing mononucleosomes. (A) Top panel: acid-urea-triton (AUT)-PAGE of the histones from HeLa cell mononucleosomes immunoprecipitated with anti-Flag agarose beads. Light chain refers to the immunoglobulin light chain from the anti-Flag agarose beads. Bottom panels: Western blots of anti-Flag, anti-H2A and anti-H4 (loading control) for the histones from immunoprecipitated mononucleosomes separated by sodium dodecyl sulphate (SDS)-PAGE. B.) Two-dimensinal PAGE analysis of HeLa cell histones with the first dimension AUT shown on top and second dimension SDS gel shown below. (C) Western blots of the histones from anti-Flag agarose bead immunoprecipitated mononucleosomes electrophoresed on 15% SDS gels. Samples were normalized with respect to Flag and total H4 levels. Antibodies used to probe the Western blots are indicated on the right. The asterisk indicates the cells were arrested in mitosis by nocodazole treatment prior to immunoprecipitation. The trends in the association of the Flag-tagged proteins with post-translationally modified forms of H3 and H4 were consistent across multiple replicates of the experiment of which a representative example is shown.
Figure 5
Figure 5
Quantitative polymerase chain reaction analysis of H2A.Z-1 and H2A.Z-2 mRNA transcript levels in adult and fetal human tissues. The abundances of H2A.Z-1 and H2A.Z-2 transcript levels were determined relative to a standard curve of known DNA amount for each primer set. Fetal levels are denoted with hatched bars while adult levels are represented by solid bars.
Figure 6
Figure 6
(A) Dissection of the putative regulatory elements in the proximal and the upstream promoter regions of H2A.Z-1 and H2A.Z-2. Elements whose relevance for H2A.Z promoter activity has been experimentally demonstrated are indicated in black boxes. The position relative to the transcription start site in the alignment, shown in Additional files 1 and 2, is indicated in each case. (B) Phylogenetic relationships among H2A.Z promoter regions in mammalian representatives. The numbers for internal nodes in the topology indicate confidence values for the groups defined (BS/IBT), both based on 1000 replications and only shown when a value is greater than 50%. Numbers in parentheses and in boldface near species names indicate the sequence variant copy and the number of sequences analysed, respectively (see Additional file 3). The tree was rooted with the H2A.Ze sequence from sea urchin, representing an early chordate in which H2A.Z-1 and H2A.Z-2 variants are not yet differentiated. (C) Logos representation of the amino acid residues at postions 15, 39 and 128 in H2A.Z-1 and H2A.Z-2. The sequences used to create the logos were the same as in (B).

Similar articles

Cited by

References

    1. Ausio J, Abbott DW. The many tales of a tail: carboxyl-terminal tail heterogeneity specializes histone H2A variants for defined chromatin function. Biochemistry. 2002;41(19):5945–5949. doi: 10.1021/bi020059d. - DOI - PubMed
    1. Ausio J. Histone variants--the structure behind the function. Brief Funct Genomic Proteomic. 2006;5(3):228–243. doi: 10.1093/bfgp/ell020. - DOI - PubMed
    1. Dryhurst D, Thambirajah AA, Ausio J. New twists on H2A.Z: a histone variant with a controversial structural and functional past. Biochem Cell Biol. 2004;82(4):490–497. doi: 10.1139/o04-043. - DOI - PubMed
    1. Rangasamy D, Berven L, Ridgway P, Tremethick DJ. Pericentric heterochromatin becomes enriched with H2A.Z during early mammalian development. Embo J. 2003;22(7):1599–1607. doi: 10.1093/emboj/cdg160. - DOI - PMC - PubMed
    1. Greaves IK, Rangasamy D, Ridgway P, Tremethick DJ. H2A.Z contributes to the unique 3D structure of the centromere. Proc Natl Acad Sci USA. 2007;104(2):525–530. doi: 10.1073/pnas.0607870104. - DOI - PMC - PubMed

Publication types