. 2009 Dec 14:9:51.
doi: 10.1186/1472-6882-9-51.

Aqueous extracts from dietary supplements influence the production of inflammatory cytokines in immortalized and primary T lymphocytes

Affiliations

Aqueous extracts from dietary supplements influence the production of inflammatory cytokines in immortalized and primary T lymphocytes

Paul R Hanlon et al. BMC Complement Altern Med. .

Abstract

Background: Congaplex and Immuplex are dietary supplements that have been traditionally used to support immune system function. The purpose of these experiments was to determine whether Congaplex and Immuplex affect immune function using primary and immortalized T lymphocytes.

Methods: Immortalized CEM and Jurkat T lymphocytes and primary peripheral mononuclear blood cells (PBMCs) were treated with the aqueous extracts from Congaplex and Immuplex to determine the effects of these products on cytokine production in activated T lymphocytes.

Results: Congaplex enhanced phytohemagglutinin/phorbol 12-myristate 13-acetate (PHA/PMA) stimulation of both CEM and Jurkat cells as measured by the production of cytokines, while Immuplex suppressed PHA/PMA-induced production of cytokines, with the exception of interleukin (IL)-8 which was enhanced by Immuplex. In vitro treatment of PBMCs from 10 healthy donors with Congaplex or Immuplex decreased PHA-stimulated production of interferon (IFN)-gamma but increased the production of IL-13.

Conclusions: While the effects of Congaplex and Immuplex differed in these two models, these data demonstrate that the aqueous extracts from these two dietary supplements can affect the inflammatory response of T lymphocytes.


Figures

Figure 1
Figure 1
The timecourse of mRNA concentration and cytokine release into the media over the first 24 hours after stimulation with PMA/PHA. CEM (A, C) and Jurkat (B, D) cells were treated with PMA and PHA as described in Materials and Methods. Cells were harvested immediately before treatment (0 hour), and 3, 6 and 24 hours after treatment. Media was assayed for cytokine concentrations (A, B) using a multiplex bead assay. Cell pellets were assayed for mRNA corresponding to the same cytokines (C, D) using real-time PCR. For both cytokine and mRNA expression, data represents the average of three replicates ± standard deviation. Cytokine expression within each of the four genes (but not between genes) were compared by ANOVA with Tukey's post-hoc test. The mean concentrations of each individual cytokine were compared between each of the four timepoints. Means of groups that share a letter are not significantly different, whereas the means of any groups that do not share a letter are significantly different (p < 0.05). The concentrations of different cytokines were not compared to each other, thus display of significance only indicates differences in the concentration of the same cytokine at different timepoints. Data are representative of 3 independent experiments, using independent cell cultures, all of which produced similar results.
Figure 2
Figure 2
Congaplex® and Immuplex® decrease the number of viable CEM and Jurkat cells at concentrations of 5 and 10 mg/mL. CEM and Jurkat cells were treated with Congaplex® and Immuplex® at the indicated concentrations for 1 hour prior to the addition of PMA and PHA. After 24 hours of treatment with PMA and PHA the number of viable cells was measured as described in Materials and Methods. Data were normalized to the relative fluorescence units for the vehicle treatment of both CEM (black bars) and Jurkat (white bars) cells. Data represents the average of four replicates ± standard deviation. * = significantly different from the vehicle treatment. Data are representative of 3 independent experiments, using independent cell cultures, all of which produced similar results.
Figure 3
Figure 3
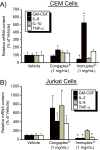
The aqueous extract from Immuplex® and Congaplex® alter cytokine release following activation. CEM (A) and Jurkat (B) cells were pre-treated the aqueous extract from Immuplex® or Congaplex® for one hour prior to treatment with PMA and PHA as described in Materials and Methods. Cells were harvested 24 hours after PMA/PHA treatment and media was assayed for cytokine concentrations using a multiplex bead assay. Data are representative of 3 independent experiments, using independent cell cultures, all of which produced similar results. Data represents the average of four replicates ± standard deviation. Data is presented as the percentage of cytokine concentration in cells treated with PMA and PHA in the absence of Immuplex® or Congaplex® treatment (vehicle). * = significantly higher than vehicle treatment. † = significantly lower than vehicle treatment.
Figure 4
Figure 4
The aqueous extract from Immuplex® and Congaplex® alter cytokine RNA expression following activation. CEM (A) and Jurkat (B) cells were pre-treated the aqueous extract from Immuplex® or Congaplex® for one hour prior to treatment with PMA and PHA as described in Materials and Methods. CEM and Jurkat cells were harvested 6 and 3 hours after PMA/PHA treatment, respectively, and cells were assayed for mRNA expression corresponding to cytokines using real-time PCR. Data are representative of 3 independent experiments, using independent cell cultures, all of which produced similar results. Data represents the average of four replicates ± standard deviation. Data is presented as the percentage of cytokine concentration in cells treated with PMA and PHA in the absence of Immuplex® or Congaplex® treatment (vehicle). * = significantly higher than vehicle treatment. † = significantly lower than vehicle treatment.
Figure 5
Figure 5
The timecourse of cytokine concentrations into the media from PBMCs over the first 3 days after stimulation with PHA. PBMCs from a healthy volunteer were exposed to PHA as described in Materials and Methods. Media from the cells was collected 1, 2 and 3 days after stimulation and was assayed for cytokine concentrations using a multiplex bead assay. Data is presented as the percentage of cytokine concentration in cells at the timepoint with maximum cytokine concentration, which in each case was 3 days after PHA stimulation. Data represents the average of three replicates ± standard deviation.
Figure 6
Figure 6
Congaplex® and Immuplex® do not decrease the number of viable PBMCs at 0.5 mg/mL. PBMCs from a healthy volunteer were treated with Congaplex® and Immuplex® at 0.5 mg/mL for 1 hour prior to the addition of PHA. After 24 hours of treatment with PHA the number of viable cells was measured as described in Materials and Methods. Data were normalized to the relative fluorescence units for the vehicle treatment. Data represents the average of three replicates ± standard deviation. * = significantly different from the vehicle treatment.
Figure 7
Figure 7
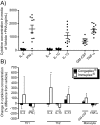
The aqueous extract from Immuplex® and Congaplex® reduce cytokine release by human PBMCs in a dose-dependent manner. PBMCs from 10 healthy volunteers were pre-treated with the aqueous extract from Immuplex® or Congaplex® at 0.5 mg/mL for one hour prior to treatment with PHA as described in Materials and Methods. Cells were harvested 3 days after treatment and media was assayed for cytokine concentrations using a multiplex bead assay. A) A scatter plot shows the concentration of each cytokine in the media from each of the 10 donors after treatment with PHA, in the absence of Congaplex® or Immuplex®. The average of all 10 donors is indicated as a horizontal bar ± standard deviation. For each donor, data represents the average of three replicates ± standard deviation. B) The effects of Congaplex® and Immuplex® on cytokine concentrations in the media of cells treated with PHA. Data are expressed as the percentage difference from treatment with PHA and vehicle treatment. The data are presented as the average response of the PBMCs from the 10 donors ± standard deviation. * = significantly different from the vehicle treatment.
Figure 8
Figure 8
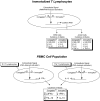
Hypothetical diagram of the mechanism through which Congaplex® and Immuplex® affect T lymphocyte function. Top Congaplex® and Immuplex® regulated the PHA/PMA-induced expression of RNA corresponding to cytokines resulting in an increase or decrease, respectively, of cytokine concentrations in the media Bottom Congaplex® and Immuplex® decreased the production of IFN-γ, the predominant Th1-specific cytokine detected in the media, and increased the production of IL-13, the predominant Th2-specific cytokine present in the media, in response to PHA.

Similar articles

References

    1. Scott P, Kaufmann SH. The role of T-cell subsets and cytokines in the regulation of infection. Immunol Today. 1991;12(10):346–348. doi: 10.1016/0167-5699(91)90063-Y. - DOI - PubMed
    1. Ziegler HK. The role of gamma/delta T cells in immunity to infection and regulation of inflammation. Immunol Res. 2004;29(1-3):293–302. doi: 10.1385/IR:29:1-3:293. - DOI - PubMed
    1. Katial RK, Sachanandani D, Pinney C, Lieberman MM. Cytokine production in cell culture by peripheral blood mononuclear cells from immunocompetent hosts. Clin Diagn Lab Immunol. 1998;5(1):78–81. - PMC - PubMed
    1. Borish L, Rosenwasser LJ. Update on cytokines. J Allergy Clin Immunol. 1996;97(3):719–733. doi: 10.1016/S0091-6749(96)80146-1. quiz 734. - DOI - PubMed
    1. Bose A, Chakraborty T, Chakraborty K, Pal S, Baral R. Dysregulation in immune functions is reflected in tumor cell cytotoxicity by peripheral blood mononuclear cells from head and neck squamous cell carcinoma patients. Cancer Immun. 2008;8:10. - PMC - PubMed

Publication types

MeSH terms