. 2009 Dec 14:2:249.
doi: 10.1186/1756-0500-2-249.

Application of hybridization control probe to increase accuracy on ligation detection or minisequencing diagnostic microarrays

Affiliations

Application of hybridization control probe to increase accuracy on ligation detection or minisequencing diagnostic microarrays

Jarmo Ritari et al. BMC Res Notes. .

Abstract

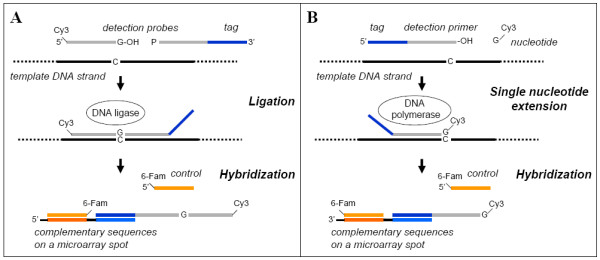
Background: Nucleic acid detection based on ligation reaction or single nucleotide extension of ssDNA probes followed by tag microarray hybridization provides an accurate and sensitive detection tool for various diagnostic purposes. Since microarray quality is crucial for reliable detection, these methods can benefit from correcting for microarray artefacts using specifically adapted techniques.

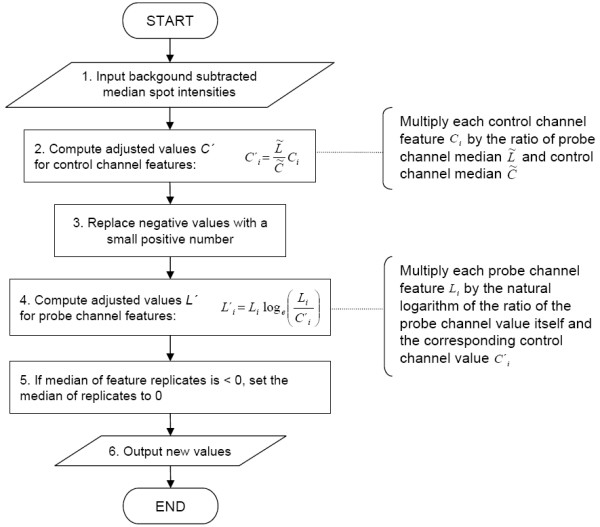
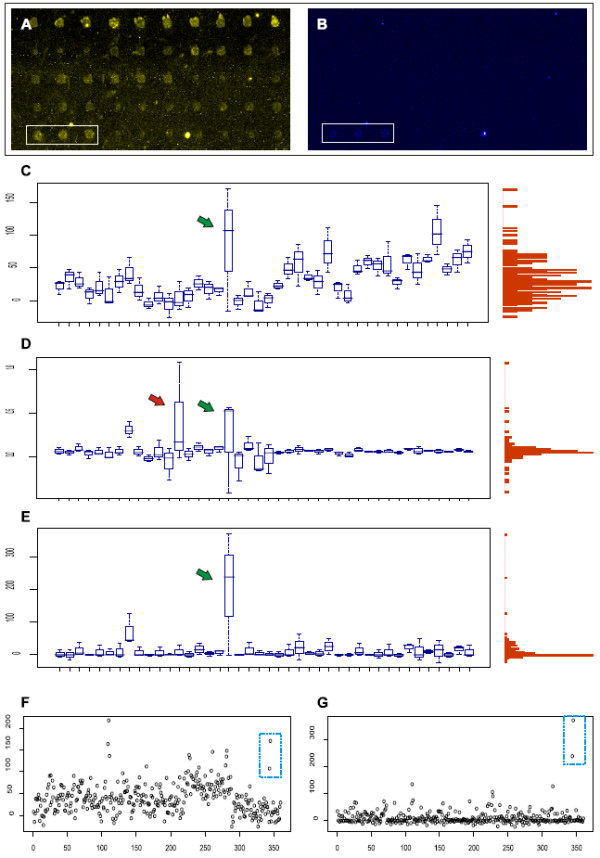
Findings: Here we demonstrate the application of a per-spot hybridization control oligonucleotide probe and a novel way of computing normalization for tag array data. The method takes into account the absolute value of the detection probe signal and the variability in the control probe signal to significantly alleviate problems caused by artefacts and noise on low quality microarrays.

Conclusions: Diagnostic microarray platforms require experimental and computational tools to enable efficient correction of array artefacts. The techniques presented here improve the signal to noise ratio and help in determining true positives with better statistical significance and in allowing the use of arrays with poor quality that would otherwise be discarded.


Figures

Figure 1
Figure 1
Principle of ligation detection and minisequencing reactions. A) Two ssDNA probes with one carrying a 5' fluorescent label and the other having a 5' phosphorylation and a 3' flanking tag sequence hybridize adjacently on target DNA. DNA ligase accepts nicked dsDNA strand as a substrate and joins the probes together if there is a perfect match to the template at the 3' end of the probe. B) Minisequencing is a similar approach using a detection primer and single dideoxynucleotide extension catalysed by DNA polymerase. The tag is in the 5' end of the primer and the nucleotide carries a fluorescent label incorporated into the 3' end. The reaction products are hybridized onto a microarray with complementary tag sequences. Each spot also harbors a complementary sequence to a 5' fluorescently labeled control probe which is read on another wavelength channel.
Figure 2
Figure 2
Flow diagram describing computational steps of the normalization algorithm. Input data are median background subtracted median spot pixel intensities. In the second step, control channel spot intensities are adjusted to the level of probe channel intensities. Next, negative values are replaced by a small number to avoid taking negative logarithm. Fourth, probe channel spot values are adjusted by multiplying the probe spot value by natural logarithm of the corresponding ratio of probe and control spot values. Finally, if median of replicate spots is negative, the difference is added to the spot values to set the median to the minimum of zero.
Figure 3
Figure 3
An example of a microarray with high background noise and poor spot quality. Plots showing results before and after applying the normalization procedure. A) and B) show a part of a microarray scanned in two channels; wavelength 488 (control with 6-Fam dye) and wavelength 532 (probes with Cy3 dye), respectively. The marked spot triplet in the bottom left corner shows a positive probe. Boxplots in C) show hybridization results of 42 detection probes with a positive probe indicated by green arrow. The probes are listed on the x-axis and their relative intensities on the right y-axis. On the left y-axis, a vertical histogram depicting the intensity distribution. The values are background subtracted detection probe channel signal intensities. D) shows the ratios of detection probe to adjusted control. Red arrow points a false positive. In E), the normalization described here is applied to the data, making positive signals better defined. F) and G) show all spots in the array before and after normalization, respectively. Marked spots in the top right corner indicate the positive probe.

Similar articles

Cited by

References

    1. Landegren U, Kaiser R, Sanders J, Hood L. A ligase-mediated gene detection technique. Science. 1988;241(4869):1077–1080. doi: 10.1126/science.3413476. - DOI - PubMed
    1. Gerry NP, Witowski NE, Day J, Hammer RP, Barany G, Barany F. Universal DNA microarray method for multiplex detection of low abundance point mutations. J Mol Biol. 1999;292(2):251–262. doi: 10.1006/jmbi.1999.3063. - DOI - PubMed
    1. Nilsson M, Malmgren H, Samiotaki M, Kwiatkowski M, Chowdhary BP, Landegren U. Padlock probes: circularizing oligonucleotides for localized DNA detection. Science. 1994;265(5181):2085–2088. doi: 10.1126/science.7522346. - DOI - PubMed
    1. Syvänen AC, Aalto-Setalä K, Harju L, Kontula K, Soderlund H. A primer-guided nucleotide incorporation assay in the genotyping of apolipoprotein E. Genomics. 1990;8(4):684–692. doi: 10.1016/0888-7543(90)90255-S. - DOI - PubMed
    1. Pastinen T, Kurg A, Metspalu A, Peltonen L, Syvänen AC. Minisequencing: a specific tool for DNA analysis and diagnostics on oligonucleotide arrays. Genome Res. 1997;7(6):606–614. - PubMed

LinkOut - more resources