

Local expression of tumor necrosis factor-receptor 1:immunoglobulin G can induce salivary gland dysfunction in a murine model of Sjögren's syndrome
- PMID: 20003451
- PMCID: PMC3003528
- DOI: 10.1186/ar2888
Local expression of tumor necrosis factor-receptor 1:immunoglobulin G can induce salivary gland dysfunction in a murine model of Sjögren's syndrome
Abstract
Introduction: Tumor necrosis factor is a pleiotropic cytokine with potent immune regulatory functions. Although tumor necrosis factor inhibitors have demonstrated great utility in treating other autoimmune diseases, such as rheumatoid arthritis, there are conflicting results in Sjögren's syndrome. The aim of this study was to assess the effect of a locally expressed tumor necrosis factor inhibitor on the salivary gland function and histopathology in an animal model of Sjögren's syndrome.
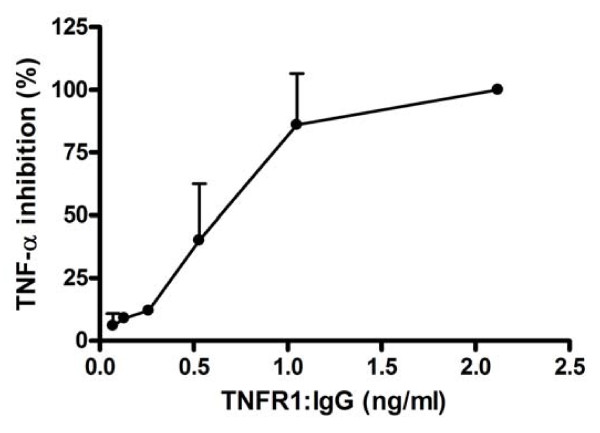
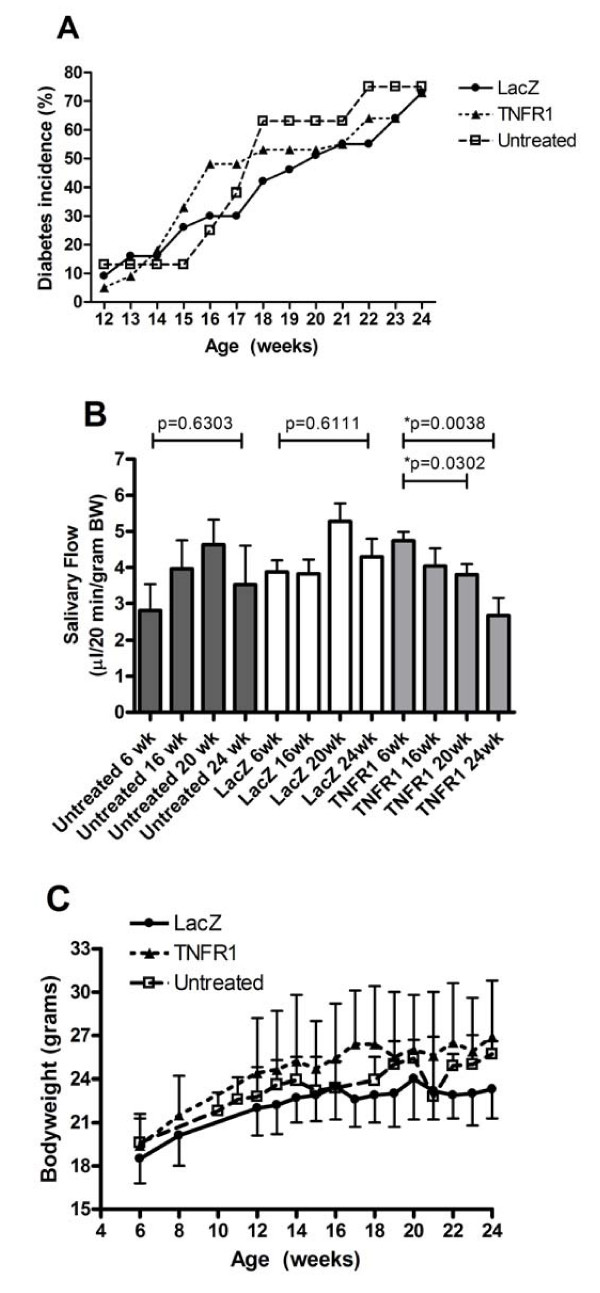
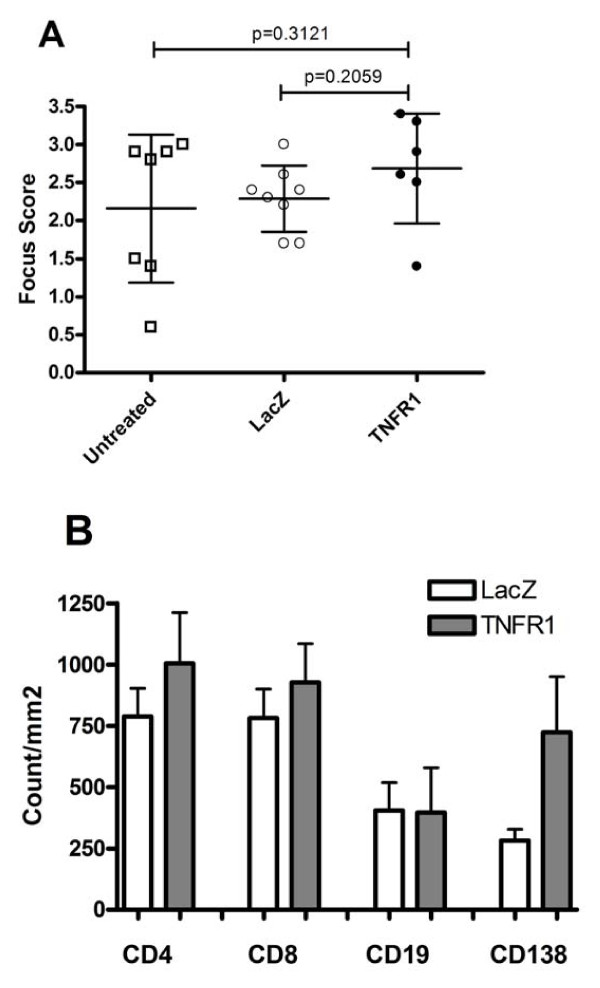
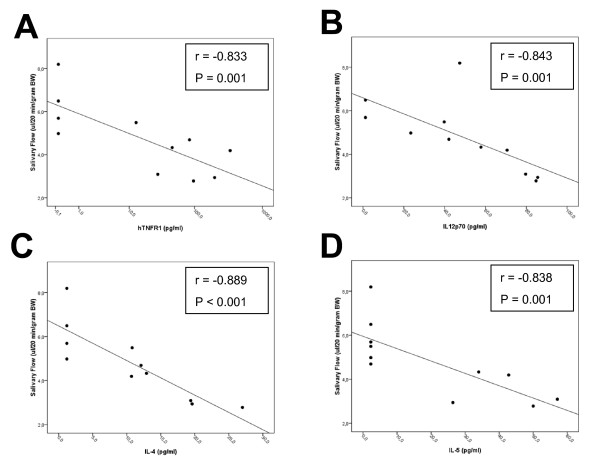
Methods: Using in vivo adeno associated viral gene transfer, we have stably expressed soluble tumor necrosis factor-receptor 1-Fc fusion protein locally in the salivary glands in the Non Obese Diabetic model of Sjögren's syndrome. Pilocarpine stimulated saliva flow was measured to address the salivary gland function and salivary glands were analyzed for focus score and cytokine profiles. Additionally, cytokines and autoantibody levels were measured in plasma.
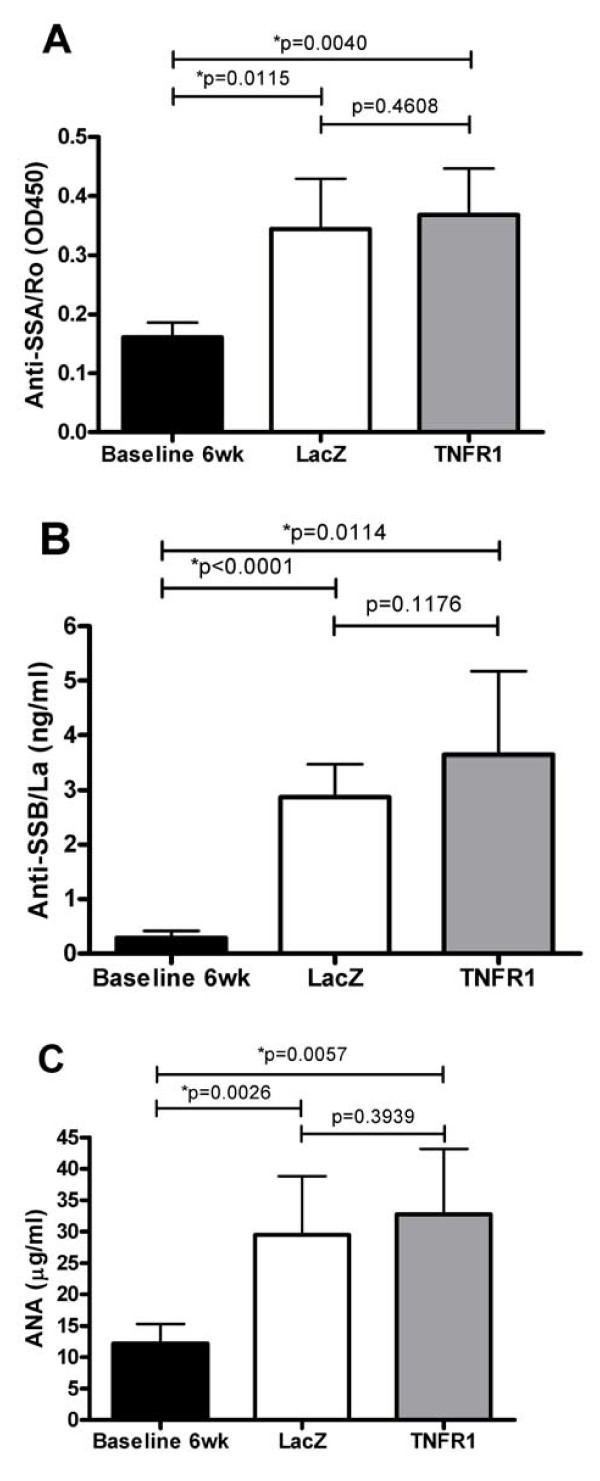
Results: Local expression of tumor necrosis factor-receptor 1:immunoglobulin G fusion protein resulted in decreased saliva flow over time. While no change in lymphocytic infiltrates or autoantibody levels was detected, statistically significant increased levels of tumor growth factor-beta1 and decreased levels of interleukin-5, interleukin-12p70 and interleukin -17 were detected in the salivary glands. In contrast, plasma levels showed significantly decreased levels of tumor growth factor-beta1 and increased levels of interleukin-4, interferon-gamma, interleukin-10 and interleukin-12p70.
Conclusions: Our findings suggest that expression of tumor necrosis factor inhibitors in the salivary gland can have a negative effect on salivary gland function and that other cytokines should be explored as points for therapeutic intervention in Sjögren's syndrome.
Figures
Similar articles
-
Metformin improves salivary gland inflammation and hypofunction in murine Sjögren's syndrome.Arthritis Res Ther. 2019 Jun 4;21(1):136. doi: 10.1186/s13075-019-1904-0. Arthritis Res Ther. 2019. PMID: 31164166 Free PMC article.
-
Impaired salivary gland function in NOD mice: association with changes in cytokine profile but not with histopathologic changes in the salivary gland.Arthritis Rheum. 2006 Jul;54(7):2300-5. doi: 10.1002/art.21945. Arthritis Rheum. 2006. PMID: 16802370
-
Local delivery of AAV2-CTLA4IgG decreases sialadenitis and improves gland function in the C57BL/6.NOD-Aec1Aec2 mouse model of Sjögren's syndrome.Arthritis Res Ther. 2012 Feb 27;14(1):R40. doi: 10.1186/ar3753. Arthritis Res Ther. 2012. PMID: 22369699 Free PMC article.
-
Cytokines in Sjögren's syndrome.Oral Dis. 2009 Nov;15(8):519-26. doi: 10.1111/j.1601-0825.2009.01582.x. Epub 2009 Jun 10. Oral Dis. 2009. PMID: 19519622 Free PMC article. Review.
-
Advances in cellular and molecular pathways of salivary gland damage in Sjögren's syndrome.Front Immunol. 2024 Jul 10;15:1405126. doi: 10.3389/fimmu.2024.1405126. eCollection 2024. Front Immunol. 2024. PMID: 39050857 Free PMC article. Review.
Cited by
-
Convenient and reproducible in vivo gene transfer to mouse parotid glands.Oral Dis. 2011 Jan;17(1):77-82. doi: 10.1111/j.1601-0825.2010.01707.x. Oral Dis. 2011. PMID: 20646229 Free PMC article.
-
Polysaccharides of Dendrobium officinale inhibit TNF-α-induced apoptosis in A-253 cell line.Inflamm Res. 2013 Mar;62(3):313-24. doi: 10.1007/s00011-012-0584-x. Epub 2012 Dec 25. Inflamm Res. 2013. PMID: 23266598
-
TACI-Fc gene therapy improves autoimmune sialadenitis but not salivary gland function in non-obese diabetic mice.Oral Dis. 2012 May;18(4):365-74. doi: 10.1111/j.1601-0825.2011.01885.x. Epub 2011 Dec 29. Oral Dis. 2012. PMID: 22212434 Free PMC article.
-
Pulmonary Involvement in Sjögren's Syndrome: Correlations with Biomarkers of Activity and High-Resolution Computer Tomography Findings.J Clin Med. 2024 Feb 15;13(4):1100. doi: 10.3390/jcm13041100. J Clin Med. 2024. PMID: 38398414 Free PMC article.
-
Targeting the splicing of mRNA in autoimmune diseases: BAFF inhibition in Sjögren's syndrome as a proof of concept.Mol Ther. 2014 Apr;22(4):821-7. doi: 10.1038/mt.2013.275. Epub 2013 Dec 5. Mol Ther. 2014. PMID: 24304965 Free PMC article.
References
Publication types
MeSH terms
Substances
Grants and funding
LinkOut - more resources
Full Text Sources
Other Literature Sources
Medical
