. 2009 Dec 14:10:109.
doi: 10.1186/1471-2199-10-109.

Characterization of the transcripts and protein isoforms for cytoplasmic polyadenylation element binding protein-3 (CPEB3) in the mouse retina

Affiliations

Characterization of the transcripts and protein isoforms for cytoplasmic polyadenylation element binding protein-3 (CPEB3) in the mouse retina

Xiang-Ping Wang et al. BMC Mol Biol. .

Abstract

Background: Cytoplasmic polyadenylation element binding proteins (CPEBs) regulate translation by binding to regulatory motifs of defined mRNA targets. This translational mechanism has been shown to play a critical role in oocyte maturation, early development, and memory formation in the hippocampus. Little is known about the presence or functions of CPEBs in the retina. The purpose of the current study is to investigate the alternative splicing isoforms of a particular CPEB, CPEB3, based on current databases, and to characterize the expression of CPEB3 in the retina.

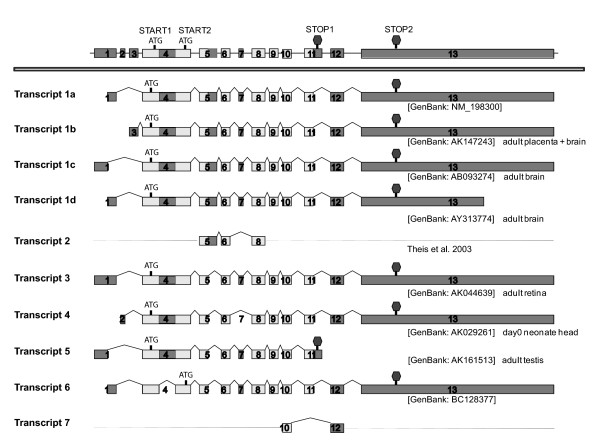
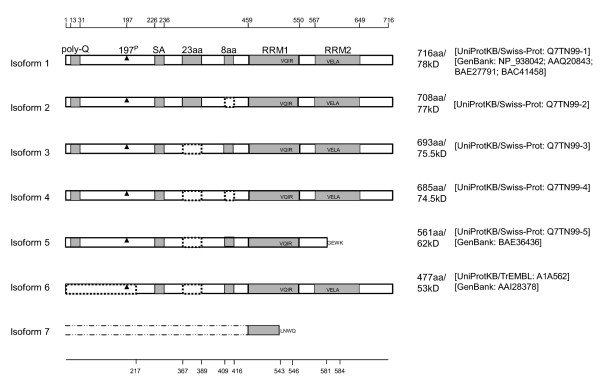
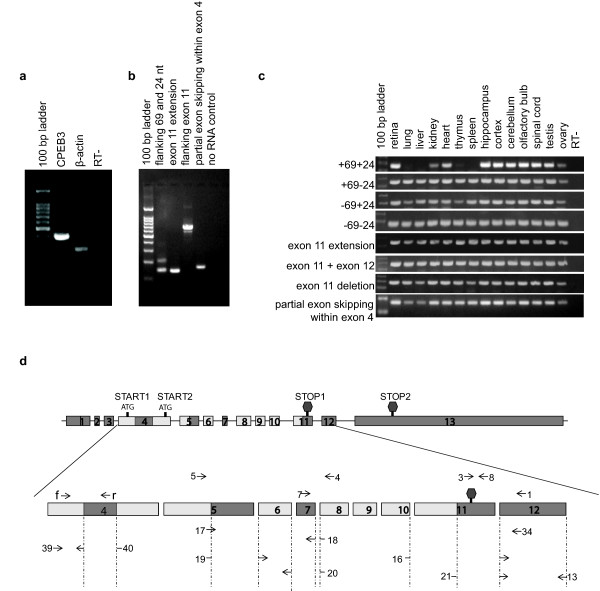
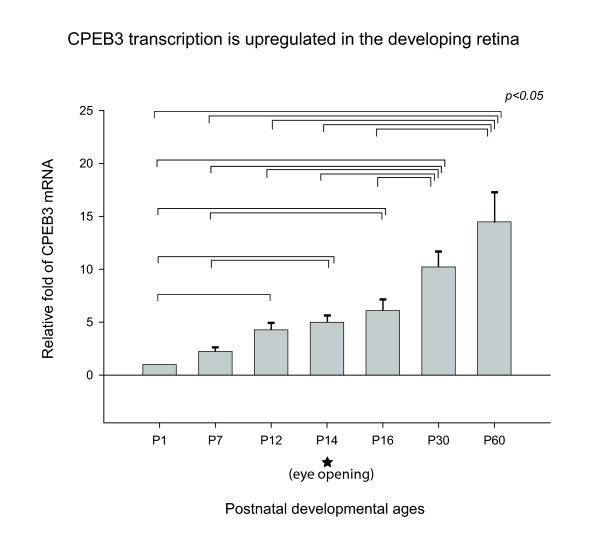
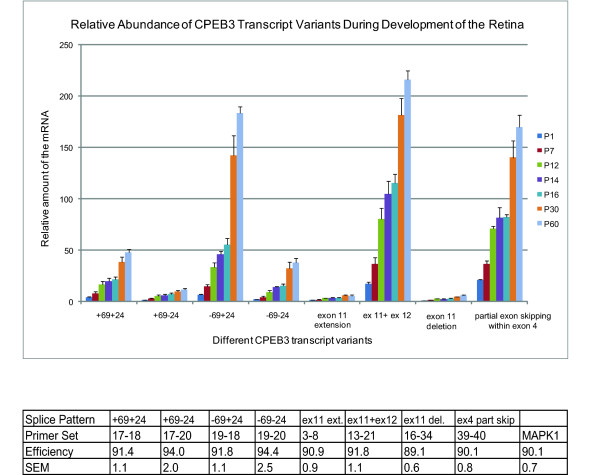
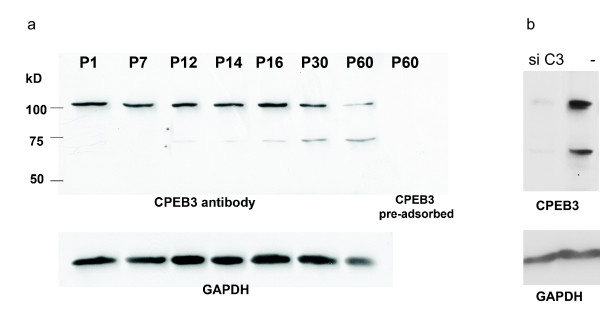
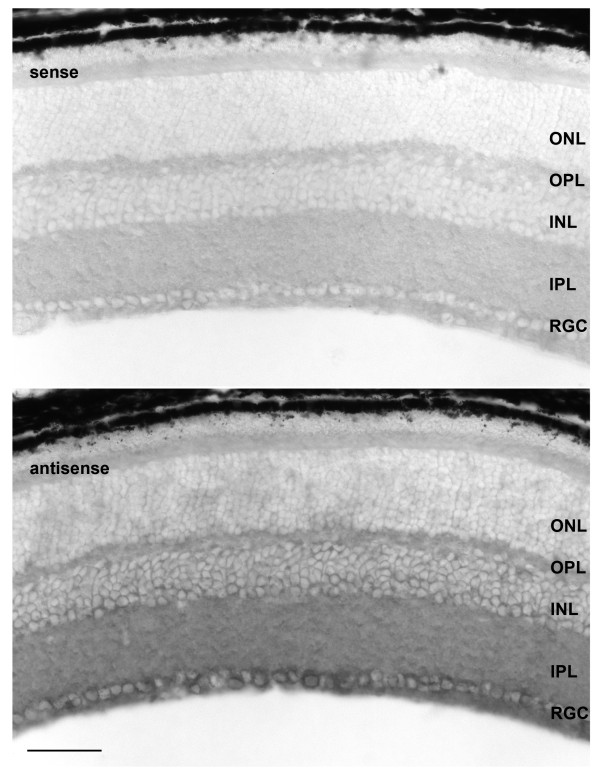
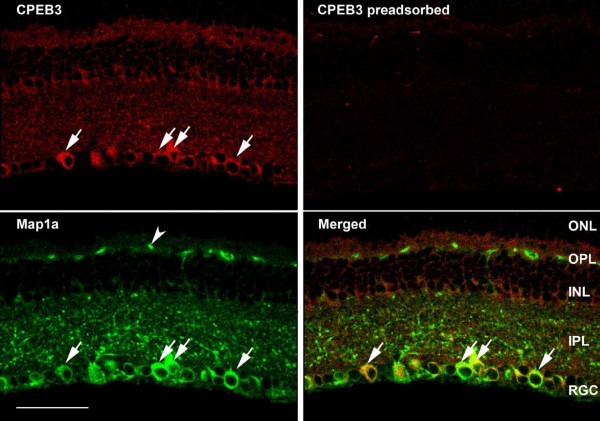
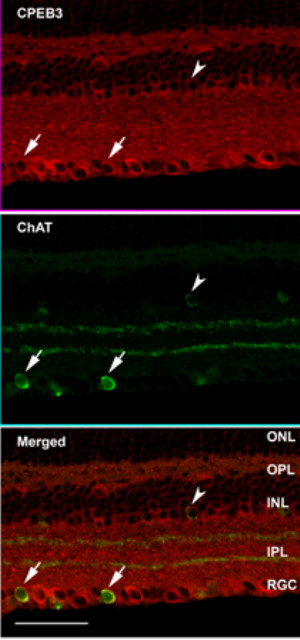
Results: In this study, we have characterized CPEB3, whose putative role is to regulate the translation of GluR2 mRNA. We identify the presence of multiple alternative splicing isoforms of CPEB3 transcripts and proteins in the current databases. We report the presence of eight alternative splicing patterns of CPEB3, including a novel one, in the mouse retina. All but one of the patterns appear to be ubiquitous in 13 types of tissue examined. The relative abundance of the patterns in the retina is demonstrated. Experimentally, we show that CPEB3 expression is increased in a time-dependent manner during the course of postnatal development, and CPEB3 is localized mostly in the inner retina, including retinal ganglion cells.

Conclusion: The level of CPEB3 was up-regulated in the retina during development. The presence of multiple CPEB3 isoforms indicates remarkable complexity in the regulation and function of CPEB3.


Figures

Figure 1
Figure 1
Known transcripts of CPEB3. Upper Panel: Representation of genomic DNA sequence. Boxes represented exons, and horizontal lines represented introns. Lower Panel: CPEB3 transcripts derived from alternative splicing. Ten transcripts were shown, with their accession numbers and types of tissue (if reported to the UniGene database) given to the right. The alternative splicings of exon 4, 5, 7 and 11 would generate different proteins products. The alternative splicings upstream of the start codon (exon 1-3) or downstream of the stop codon (exon 13) would give rise to different 5' and 3' UTRs, respectively. Dashed lines represented undetermined sequences. Partial sequence of transcript 2 (exon 5-7) was confirmed with the aid of PCR in a previous study [10], but its complete sequence was not documented in the UniGene database. Transcript 7 was a novel variant identified in the current study, of which the sequence upstream of exon 10 and downstream of exon 12 was not determined. Translational start codons and stop codons were annotated on top of the genomic DNA. Darkened boxed represented exons that could be alternatively spliced.
Figure 2
Figure 2
Known isoforms of CPEB3 proteins. Gray boxes represented possible functional motifs. Dash-lined boxed represented deletions. For simplicity, the names of the motifs were only labeled in isoform 1. Poly-Q (poly-glutamine) and SA (poly serine-alanine) were two unique motifs of CPEB3 that were absent in the other three CPEBs. In the current study, each of the seven isoforms was named corresponding to the same numbered cDNA transcripts depicted in figure 1. Protein isoform 1 was the longest (716 aa) and may be derived from cDNA transcripts 1a-1d. One possible polymorphorism was located at the 372th amino acid of CPEB3 isoform 1: it was an N (asparagine) in [UniProtKB/Swiss-Prot: Q7TN99-Q7TN101] and [GenBank: AAQ20843] but a P (proline) in [GenBank: NP_938042, BAE27791, BAC41458]. Although the sequence of [GenBank: BAC41458] was reported as 722 aa, we presume it was 716 aa, since the first 6 amino acids QQAAQT preceding the 7th amino acid M (methionine) was likely to be falsely generated by the prediction software. Isoform 7 was derived from computational translation based on the novel transcript 7 identified in the current study. The upstream sequence of this isoform was yet to be determined; but the in-frame translation of the identified sequence would result in truncated RRM1 ending with four unique amino acids (LNWQ) and removal of RRM2. 197P represented the 197th serine, a phosphorylation site [31]. The positions of the gray-box and dash-lined-box motifs were indicated at the top and the bottom, respectively. The lengths, molecular sizes and accession numbers were indicated to the right.
Figure 3
Figure 3
The expression of CPEB3 as demonstrated by RT-PCR. a) CPEB3 was present in the P60 retina. b) Multiple CPEB3 transcripts were present in the retina. Different primer sets for various CPEB3 transcripts (table1, table 2) were used for PCR. Each visible band was purified and sequenced, which confirmed the presence of six splicing patterns: "+69+24" (lane2, upper band), "-69+24" (lane2, lower band), "exon 11 extension" (lane3), "exon 11 + exon 12" (lane 4, upper band); a new pattern: "exon 11 deletion" (lane 4, lower band), and "partial exon skipping within exon 4". But it did not rule out the presence of "+69-24" and "-69-24", since the competition for the same set of primers by a dominant pattern ("-69+24") may mask the weakly expressed variants. c) Demonstration of "+69-24" and "-69-24" patterns and comparison of tissue distribution of all patterns. Primer sets specific for each individual splicing pattern were used for PCR on thirteen different tissues from adult mice. Each specific band was purified and sequenced for identity confirmation. The results demonstrated the presence of "+69-24" and "-69-24" patterns in the retina (lane 2) in addition to the 6 patterns identified in figure b). It also demonstrated the ubiquity of the majority of the patterns, with the exception of "+69+24", which was expressed in the CNS, the ovary, testis, kidney and heart, but not in the lung, liver, thymus and spleen. d) The locations of these primers were mapped to CPEB3. The corresponding relationships between the numeric primers and the splicing variants in figure a), b) and c) were listed in table 2. Darkened boxed represented exons that could be alternatively spliced.
Figure 4
Figure 4
CPEB3 mRNA during postnatal development. The relative fold change in the amount of CPEB3 mRNA was shown with the aid of real-time PCR. Seven postnatal ages flanking the eye-opening event were used for this study. For each sample, the level of CPEB3 mRNA was normalized to that of 18S RNA in the exact same sample. All experiments were repeated three times. All ages were calibrated relative to the postnatal age P1 and expressed as fold changes. Statistically significant differences were found by ANOVA between sets of two bracketed ages as indicated (p <= 0.05). For each age, the number of samples n >= 6. Error bars represented standard error of the mean (SEM). The asterisk indicated the approximate time of eye-opening. The results demonstrated that CPEB3 was significantly up-regulated in the retina from P1 to P12 (before eye-opening), and from P16 to P30 (after eye opening), and reached maximum in the adulthood (P60).
Figure 5
Figure 5
Relative abundance of different CPEB3 transcript patterns during development of the retina. The levels of each mRNA was normalized to the level of MAPK1 mRNA in the same sample. All the transcript variants demonstrated similar increasing trends during postnatal development. The relative abundance at any given age demonstrated that the "-69+24" pattern was the most abundant in exon 5-7 region; the "ex 11 + ex 12" pattern was the most abundant in the region surrounding exon 11; and "partial exon skipping within exon 4" pattern was abundant. For age P14, n = 3; for all the other ages, n = 4. Error bars represented standard error of the mean (SEM). The amplification efficiencies for all the primer sets used in realtime PCR were listed in the table below the graph.
Figure 6
Figure 6
The expression of CPEB3 proteins in the retina. a) The regulation of CPEB3 protein during the postnatal development of the retina. CPEB3 western blot on retinal samples from seven different postnatal ages showed that the 75 kD band protein was increased during the development. Another band at ~130 kD was also present in the retina. Both bands diminished when the antibody was pre-adsorbed with the recombinant CPEB3 protein (the last lane). GAPDH was used as a loading control. b) Both of the 75 kD and the 130 kD bands diminished when Hela cells were transfected with CPEB3 siRNA. Cells in the negative control were treated with a negative control siRNA. GAPDH was used as a loading control.
Figure 7
Figure 7
In situ hybridization of CPEB3 on P60 mouse retina. Sense probe complementary to the antisense probe was used for the negative control. The probes were designed in a region with no significant homology to any other CPEB to ensure specificity. The expression of CPEB3 mRNA was located mostly in the RGC layer and to a lesser extent, the INL. Scale bar represented 50 μm. ONL: outer nuclear layer; OPL: outer plexiform layer; INL: inner nuclear layer; IPL: inner plexiform layer; RGC: retinal ganglion cell layer.
Figure 8
Figure 8
The presence of CPEB3 in P60 mouse retina. We used double-immunofluorescence labeling with antibodies to CPEB3 and Map1a. Map1a has been demonstrated as a marker for retinal ganglion cells. Most cells in the RGC layer were double-labeled with CPEB3 and Map1a antibodies (arrows), suggesting that they are retinal ganglion cells. The INL was also labeled with CPEB3 antibody, with the innermost cells more intensely labeled. Both the IPL and the OPL were labeled with CPEB3 antibody. The Map1a containing structures (arrowhead) in the OPL were non-specific since they also appeared in no primary control. The scale bar represented 50 μm.
Figure 9
Figure 9
The presence of CPEB3 in P60 mouse retina. We used double-immunofluorescence labeling with antibodies to CPEB3 and ChAT. ChAT is a marker for cholinergic amacrine cells. A few cells in the RGC layer were double-labeled with ChAT and CPEB3 antibodies, as indicated with the arrows. This suggested that a few CPEB3 positive cells in the RGC layer were displaced amacrine cells. The size of such cells was usually smaller than those cells staining positive for both CPEB3 and Map1a. The INL was also labeled with CPEB3, with the innermost cells more intensely labeled. A few cells in the INL appeared to be double-immunopositive for ChAT and CPEB3 (arrowhead), suggesting that some CPEB3 positive cells in the INL were cholinergic amacrine cells. Both the IPL and the OPL were labeled with CPEB3. Scale bar represented 50 μm.

Similar articles

Cited by

References

    1. Gebauer F, Hentze MW. Molecular mechanisms of translational control. Nat Rev Mol Cell Biol. 2004;5:827–835. doi: 10.1038/nrm1488. - DOI - PMC - PubMed
    1. Gebauer F, Richter JD. Mouse cytoplasmic polyadenylylation element binding protein: an evolutionarily conserved protein that interacts with the cytoplasmic polyadenylylation elements of c-mos mRNA. Proc Natl Acad Sci USA. 1996;93:14602–14607. doi: 10.1073/pnas.93.25.14602. - DOI - PMC - PubMed
    1. Good L. Translation repression by antisense sequences. Cell Mol Life Sci. 2003;60:854–861. - PMC - PubMed
    1. Clegg KB, Piko L. RNA synthesis and cytoplasmic polyadenylation in the one-cell mouse embryo. Nature. 1982;295:343–344. doi: 10.1038/295342a0. - DOI - PubMed
    1. Clegg KB, Piko L. Quantitative aspects of RNA synthesis and polyadenylation in 1-cell and 2-cell mouse embryos. J Embryol Exp Morphol. 1983;74:169–182. - PubMed

Publication types

LinkOut - more resources