

Spatial autocorrelation analysis of health care hotspots in Taiwan in 2006
- PMID: 20003460
- PMCID: PMC2799414
- DOI: 10.1186/1471-2458-9-464
Spatial autocorrelation analysis of health care hotspots in Taiwan in 2006
Abstract
Background: Spatial analytical techniques and models are often used in epidemiology to identify spatial anomalies (hotspots) in disease regions. These analytical approaches can be used to not only identify the location of such hotspots, but also their spatial patterns.
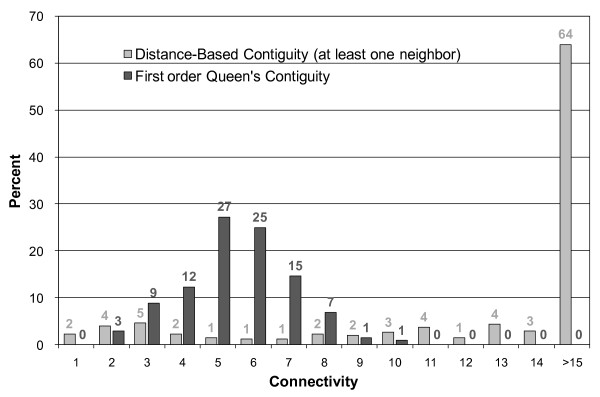
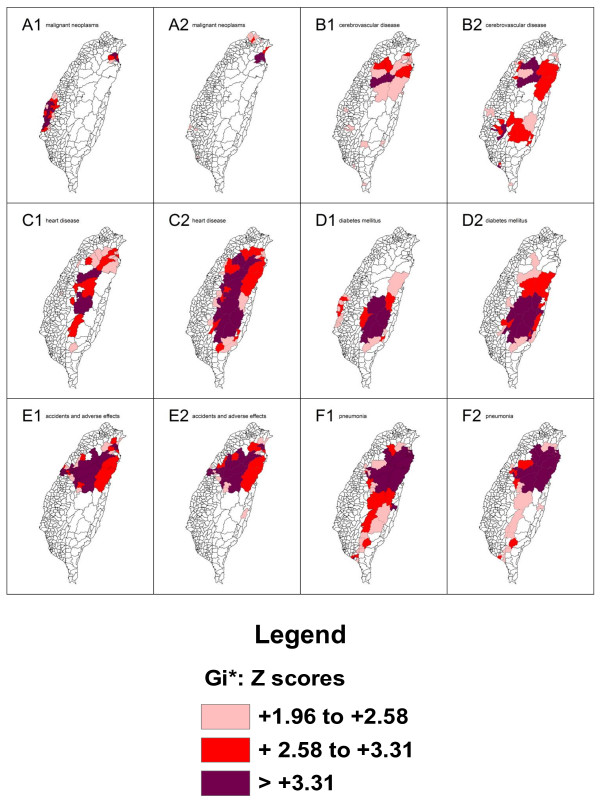
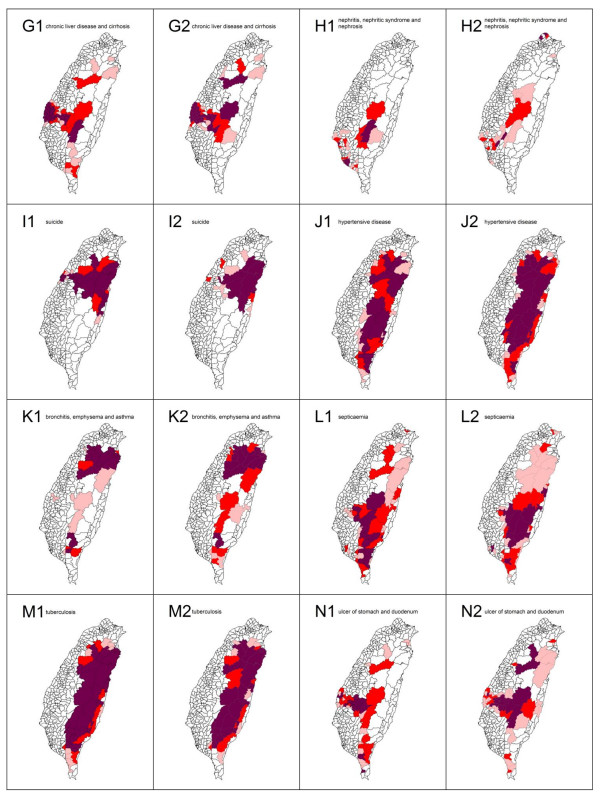
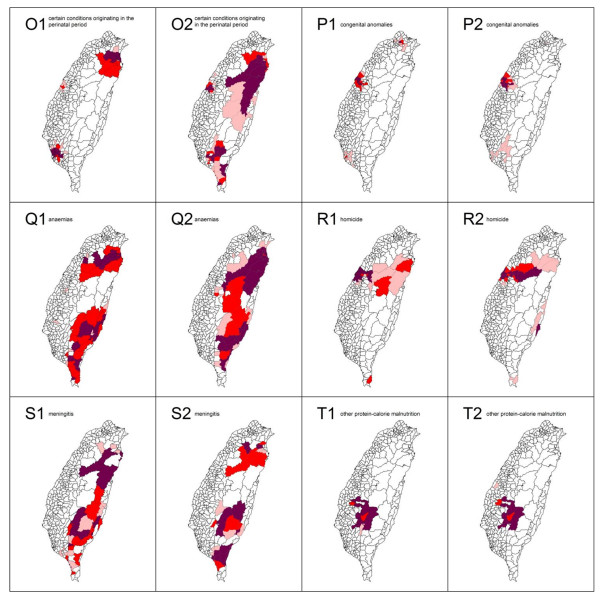
Methods: In this study, we utilize spatial autocorrelation methodologies, including Global Moran's I and Local Getis-Ord statistics, to describe and map spatial clusters, and areas in which these are situated, for the 20 leading causes of death in Taiwan. In addition, we use the fit to a logistic regression model to test the characteristics of similarity and dissimilarity by gender.
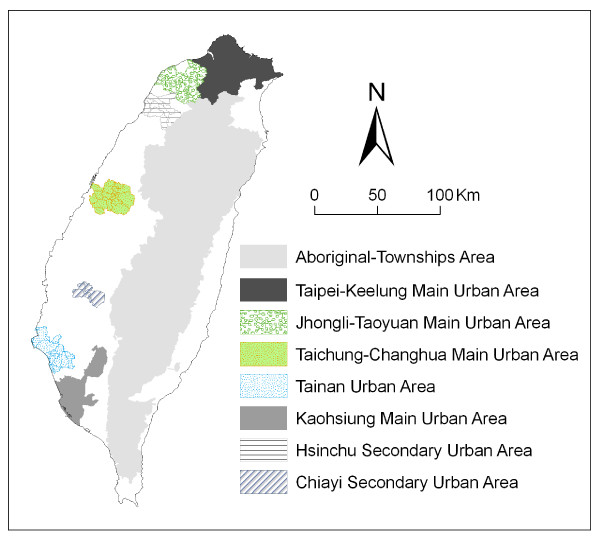
Results: Gender is compared in efforts to formulate the common spatial risk. The mean found by local spatial autocorrelation analysis is utilized to identify spatial cluster patterns. There is naturally great interest in discovering the relationship between the leading causes of death and well-documented spatial risk factors. For example, in Taiwan, we found the geographical distribution of clusters where there is a prevalence of tuberculosis to closely correspond to the location of aboriginal townships.
Conclusions: Cluster mapping helps to clarify issues such as the spatial aspects of both internal and external correlations for leading health care events. This is of great aid in assessing spatial risk factors, which in turn facilitates the planning of the most advantageous types of health care policies and implementation of effective health care services.
Figures

Similar articles
-
Spatial autocorrelation calculations of the nine malignant neoplasms in Taiwan in 2005-2009: a gender comparison study.Chin J Cancer. 2011 Nov;30(11):757-65. doi: 10.5732/cjc.011.10122. Chin J Cancer. 2011. PMID: 22035856 Free PMC article.
-
Application of Moran's test with an empirical Bayesian rate to leading health care problems in Taiwan in a 7-year period (2002-2008).Glob J Health Sci. 2012 Jul 24;4(5):63-77. doi: 10.5539/gjhs.v4n5p63. Glob J Health Sci. 2012. PMID: 22980379 Free PMC article.
-
Socio-Demographic Predictors and Distribution of Pulmonary Tuberculosis (TB) in Xinjiang, China: A Spatial Analysis.PLoS One. 2015 Dec 7;10(12):e0144010. doi: 10.1371/journal.pone.0144010. eCollection 2015. PLoS One. 2015. PMID: 26641642 Free PMC article. Clinical Trial.
-
Exploring spatial autocorrelation of traffic crashes based on severity.Injury. 2017 Mar;48(3):637-647. doi: 10.1016/j.injury.2017.01.032. Epub 2017 Jan 19. Injury. 2017. PMID: 28126318 Review.
-
Epidemiological patterns and spatiotemporal analysis of cardiovascular disease mortality in Iran: Development of public health strategies and policies.Curr Probl Cardiol. 2024 Aug;49(8):102675. doi: 10.1016/j.cpcardiol.2024.102675. Epub 2024 May 23. Curr Probl Cardiol. 2024. PMID: 38795799 Review.
Cited by
-
Geographic variation in pharmacotherapy decisions for U.S. Medicare enrollees with diabetes.J Diabetes Complications. 2012 Jul-Aug;26(4):301-7. doi: 10.1016/j.jdiacomp.2012.04.001. Epub 2012 May 31. J Diabetes Complications. 2012. PMID: 22658408 Free PMC article.
-
Spatio-Temporal Disparity and Driving Forces of the Supply Level of Healthcare Service in the Yangtze River Delta.Front Public Health. 2022 Apr 21;10:863571. doi: 10.3389/fpubh.2022.863571. eCollection 2022. Front Public Health. 2022. PMID: 35530733 Free PMC article.
-
Spatial distribution, prevalence and potential risk factors of Tungiasis in Vihiga County, Kenya.PLoS Negl Trop Dis. 2019 Mar 12;13(3):e0007244. doi: 10.1371/journal.pntd.0007244. eCollection 2019 Mar. PLoS Negl Trop Dis. 2019. PMID: 30860992 Free PMC article.
-
Geographic weighted regression analysis of hot spots of anemia and its associated factors among children aged 6-59 months in Ethiopia: A geographic weighted regression analysis and multilevel robust Poisson regression analysis.PLoS One. 2021 Nov 4;16(11):e0259147. doi: 10.1371/journal.pone.0259147. eCollection 2021. PLoS One. 2021. PMID: 34735486 Free PMC article.
-
Spatial variation and associated factors of home delivery among reproductive age group women in Ethiopia, evidence from Performance Monitoring for Action Ethiopia Survey 2019, spatial and multilevel logistic regression analysis.Front Glob Womens Health. 2024 Dec 16;5:1474762. doi: 10.3389/fgwh.2024.1474762. eCollection 2024. Front Glob Womens Health. 2024. PMID: 39737366 Free PMC article.
References
-
- National Health Insurance. Statistical Annual Report of Medical Care 2006. Taipei: National Health Insurance, Republic of China (Taiwan); 2008.
-
- Douven W, Scholten HJ. In: The Added Value of Geographical Information Systems in Public and Environmental Health. de Lepper MJC, Scholten HJ, Stern RM, editor. Boston, MA: Kluwer Academic Press; 1995. Spatial analysis in health research; pp. 117–133.
-
- Waller LA, Gotway CA. Applied Spatial Statistics for Public Health Data. Hoboken, NJ: John Wiley and Sons; 2004. full_text.
-
- Cuzick J, Edwards R. Spatial clustering for inhomogeneous populations. J R Stat Soc. 1990;52:73–104.
Publication types
MeSH terms
LinkOut - more resources
Full Text Sources
