. 2009 Dec 15:9:259.
doi: 10.1186/1471-2180-9-259.

Defining the healthy "core microbiome" of oral microbial communities

Affiliations

Defining the healthy "core microbiome" of oral microbial communities

Egija Zaura et al. BMC Microbiol. .

Abstract

Background: Most studies examining the commensal human oral microbiome are focused on disease or are limited in methodology. In order to diagnose and treat diseases at an early and reversible stage an in-depth definition of health is indispensible. The aim of this study therefore was to define the healthy oral microbiome using recent advances in sequencing technology (454 pyrosequencing).

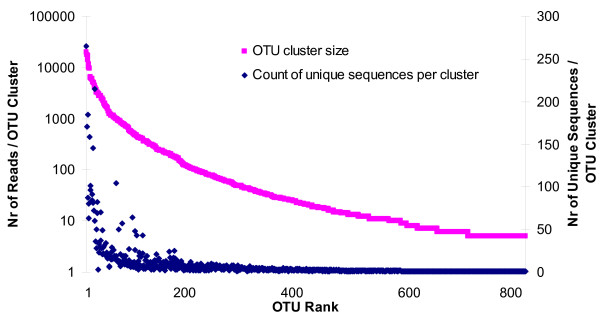
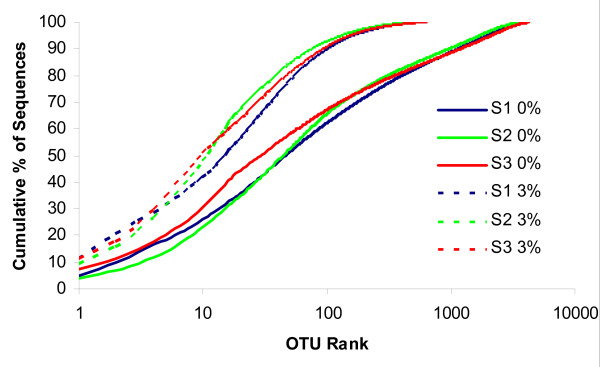
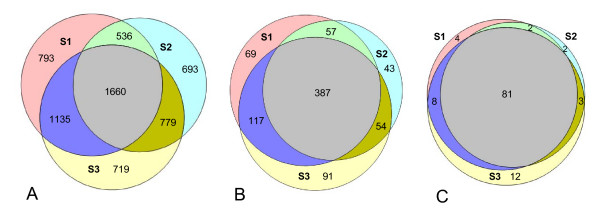
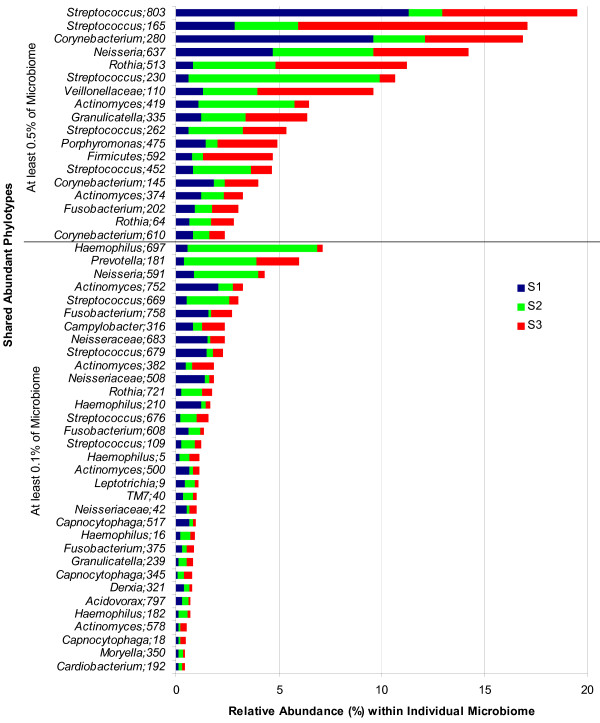
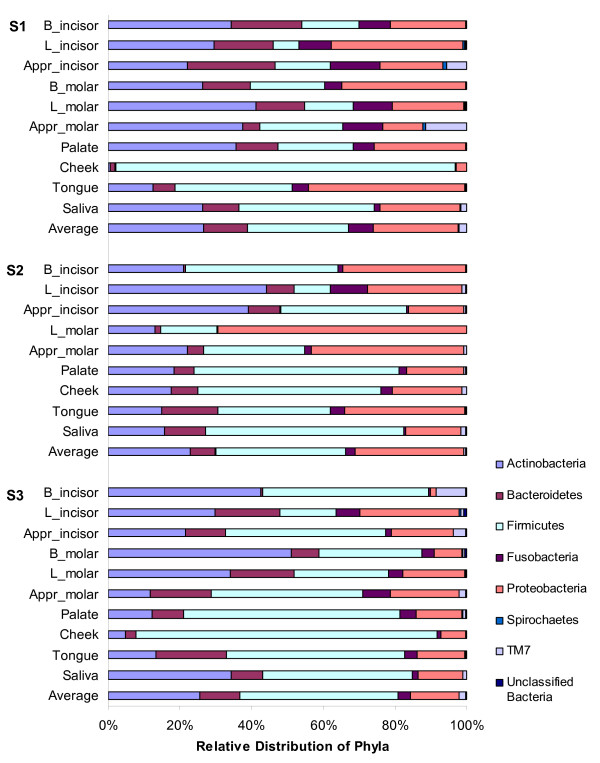
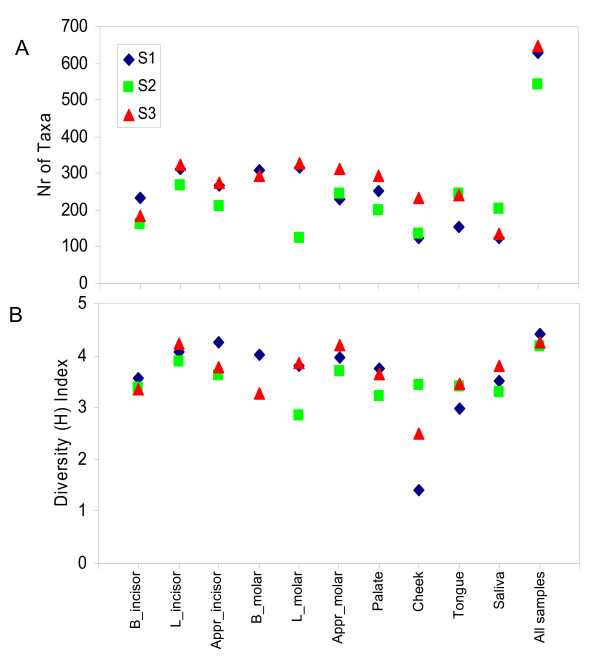
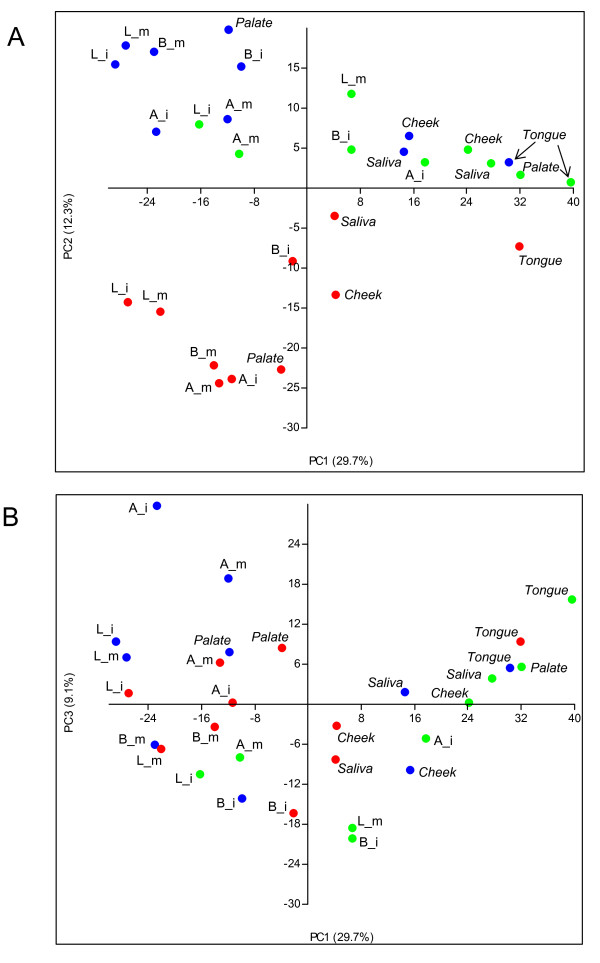
Results: We sampled and sequenced microbiomes from several intraoral niches (dental surfaces, cheek, hard palate, tongue and saliva) in three healthy individuals. Within an individual oral cavity, we found over 3600 unique sequences, over 500 different OTUs or "species-level" phylotypes (sequences that clustered at 3% genetic difference) and 88 - 104 higher taxa (genus or more inclusive taxon). The predominant taxa belonged to Firmicutes (genus Streptococcus, family Veillonellaceae, genus Granulicatella), Proteobacteria (genus Neisseria, Haemophilus), Actinobacteria (genus Corynebacterium, Rothia, Actinomyces), Bacteroidetes (genus Prevotella, Capnocytophaga, Porphyromonas) and Fusobacteria (genus Fusobacterium).Each individual sample harboured on average 266 "species-level" phylotypes (SD 67; range 123 - 326) with cheek samples being the least diverse and the dental samples from approximal surfaces showing the highest diversity. Principal component analysis discriminated the profiles of the samples originating from shedding surfaces (mucosa of tongue, cheek and palate) from the samples that were obtained from solid surfaces (teeth).There was a large overlap in the higher taxa, "species-level" phylotypes and unique sequences among the three microbiomes: 84% of the higher taxa, 75% of the OTUs and 65% of the unique sequences were present in at least two of the three microbiomes. The three individuals shared 1660 of 6315 unique sequences. These 1660 sequences (the "core microbiome") contributed 66% of the reads. The overlapping OTUs contributed to 94% of the reads, while nearly all reads (99.8%) belonged to the shared higher taxa.

Conclusions: We obtained the first insight into the diversity and uniqueness of individual oral microbiomes at a resolution of next-generation sequencing. We showed that a major proportion of bacterial sequences of unrelated healthy individuals is identical, supporting the concept of a core microbiome at health.


Figures

Figure 1
Figure 1
The size of OTU clusters and the number of unique sequences per cluster. The number of reads within each OTU (sequences that clustered at 3% genetic distance level) and the number of unique sequences per OTU are plotted in the rank order of OTU cluster size (high to low).
Figure 2
Figure 2
The relative abundance of OTUs per individual. Relative abundance of OTUs based on all unique sequences (0%, solid lines) and OTUs within genetic distances that do not exceed 3% difference (3%, dashed lines) per individual S1, S2 and S3, respectively. The x-axis indicates the individual OTUs, ranked according to their relative abundance (high to low). The y-axis indicates the cumulative abundance of the OTUs.
Figure 3
Figure 3
The extent of overlap of oral microbiome between three individuals. The extent of overlap between subjects S1 (pink circle), S2 (light blue circle) and S3 (yellow circle) at the level of A) unique sequences, B) OTUs clustered at 3% difference and C) higher taxa (genus or more inclusive taxon). The data was obtained by combining all samples of the respective individual microbiome. The Venn Diagrams show that 26% of the unique sequences, 47% of the OTUs and 72% of the higher taxa were common (area in grey) to the three individuals.
Figure 4
Figure 4
Shared abundant phylotypes in three oral microbiomes and their relative abundance. Relative abundance of shared phylotypes within an individual microbiome. Only abundant phylotypes that contributed to at least 0.1% of the individual microbiome are shown. The most abundant phylotypes (≥0.5% of the microbiome) are grouped separately in the upper panel. Phylotypes were defined as OTUs clustering sequences at a 3% genetic difference. The highest taxon (in most cases, genus) at which the OTU was identified, is shown together with the cluster identification number. The full list of OTUs is available in Additional file 1. Different colours indicate three different microbiomes, S1, S2 and S3, respectively.
Figure 5
Figure 5
Average and site-specific relative distribution of bacterial phyla in three individuals. Average and site-specific relative distribution of bacterial phyla in three individuals (S1, S2 and S3). Unclassified bacteria were reads without a recognizable match in the full 16S rRNA reference database. Sample legend: B - buccal, L - lingual, Appr - approximal surface of either an incisor (a front tooth) or a molar tooth.
Figure 6
Figure 6
Diversity statistics of individual samples. Diversity statistics: A) number of taxa (OTUs clustering sequences at a 3% genetic difference) per sampling site for each individual; B) diversity index - Shannon diversity index, H, taking into account the number and the proportion (abundance) of taxa.
Figure 7
Figure 7
Principal Component Analysis results on individual samples. Principal Component Analysis (PCA) results on all individual samples at the level of OTUs clustering sequences at a 3% difference: A) the plot of the PCA axis 1 (accounting for 29.7% of intersample variation) and the axis 2 (12.3% of intersample variation); B) the plot of the PCA axis 1 and the axis 3 (9.1% of intersample variation). Blue dots - samples from individual S1, green dots - samples from individual S2, red dots - individual S3. A - approximal, B - buccal, L - lingual surface of i - incisor or m - molar tooth, respectively. Data were normalized to an equal number of reads per sample and log2 transformed.

Similar articles

Cited by

References

    1. Turnbaugh PJ, Hamady M, Yatsunenko T, Cantarel BL, Duncan A, Ley RE, Sogin ML, Jones WJ, Roe BA, Affourtit JP, Egholm M, Henrissat B, Heath AC, Knight R, Gordon JI. A core gut microbiome in obese and lean twins. Nature. 2009;457:480–484. doi: 10.1038/nature07540. - DOI - PMC - PubMed
    1. Wilson M. Bacteriology of Humans: An Ecological Perspective. Malden, MA: Blackwell Publishing Ltd; 2008.
    1. Voelkerding KV, Dames SA, Durtschi JD. Next-generation sequencing: from basic research to diagnostics. Clin Chem. 2009;55:641–658. doi: 10.1373/clinchem.2008.112789. - DOI - PubMed
    1. Keijser BJF, Zaura E, Huse SM, van der Vossen JMBM, Schuren FHJ, Montijn RC, ten Cate JM, Crielaard W. Pyrosequencing analysis of the oral microflora of healthy adults. J Dent Res. 2008;87:1016–1020. doi: 10.1177/154405910808701104. - DOI - PubMed
    1. Paster BJ, Olsen I, Aas JA, Dewhirst FE. The breadth of bacterial diversity in the human periodontal pocket and other oral sites. Periodontol 2000. 2006;42:80–87. doi: 10.1111/j.1600-0757.2006.00174.x. - DOI - PubMed

Publication types

LinkOut - more resources