. 2009 Dec 15:2:68.
doi: 10.1186/1755-8794-2-68.

A transcriptomic computational analysis of mastic oil-treated Lewis lung carcinomas reveals molecular mechanisms targeting tumor cell growth and survival

Affiliations

A transcriptomic computational analysis of mastic oil-treated Lewis lung carcinomas reveals molecular mechanisms targeting tumor cell growth and survival

Panagiotis Moulos et al. BMC Med Genomics. .

Abstract

Background: Mastic oil from Pistacia lentiscus variation chia, a blend of bioactive terpenes with recognized medicinal properties, has been recently shown to exert anti-tumor growth activity through inhibition of cancer cell proliferation, survival, angiogenesis and inflammatory response. However, no studies have addressed its mechanisms of action at genome-wide gene expression level.

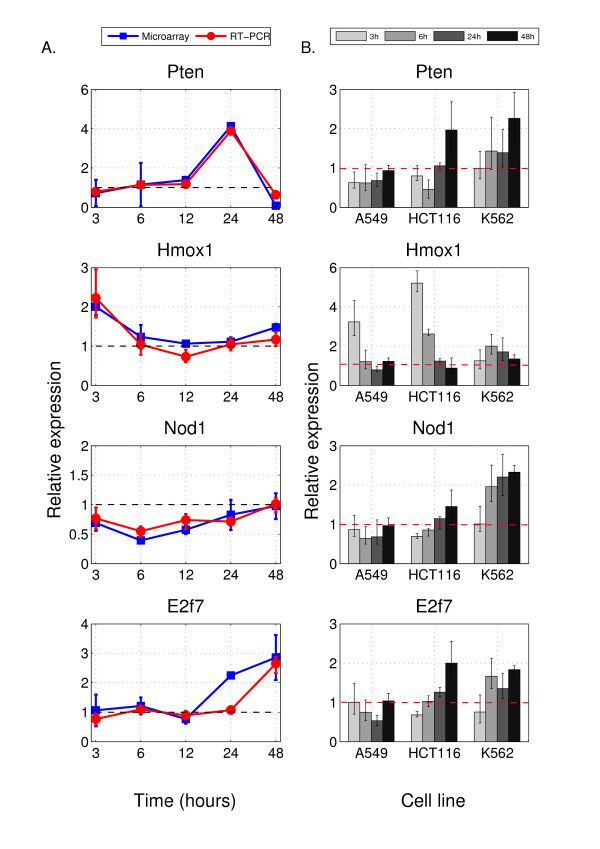
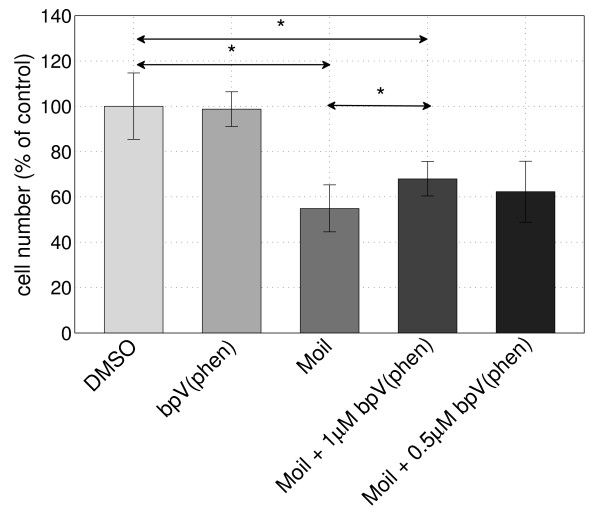
Methods: To investigate molecular mechanisms triggered by mastic oil, Lewis Lung Carcinoma cells were treated with mastic oil or DMSO and RNA was collected at five distinct time points (3-48 h). Microarray expression profiling was performed using Illumina mouse-6 v1 beadchips, followed by computational analysis. For a number of selected genes, RT-PCR validation was performed in LLC cells as well as in three human cancer cell lines of different origin (A549, HCT116, K562). PTEN specific inhibition by a bisperovanadium compound was applied to validate its contribution to mastic oil-mediated anti-tumor growth effects.

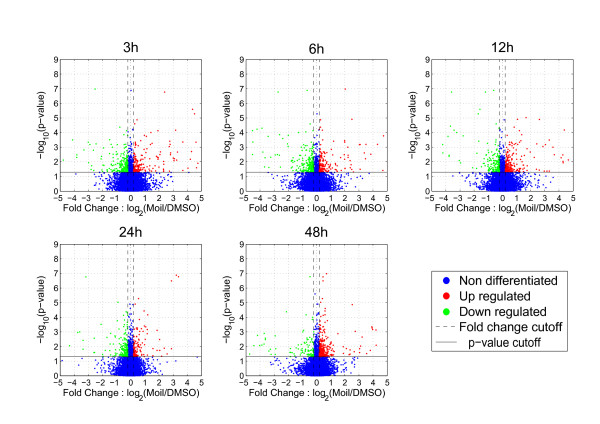
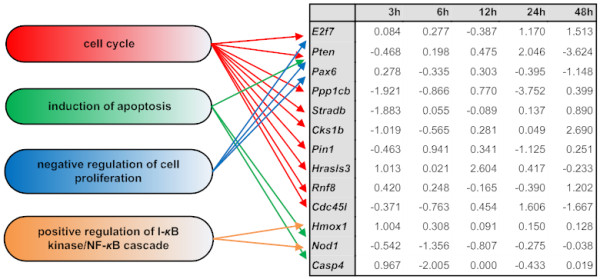
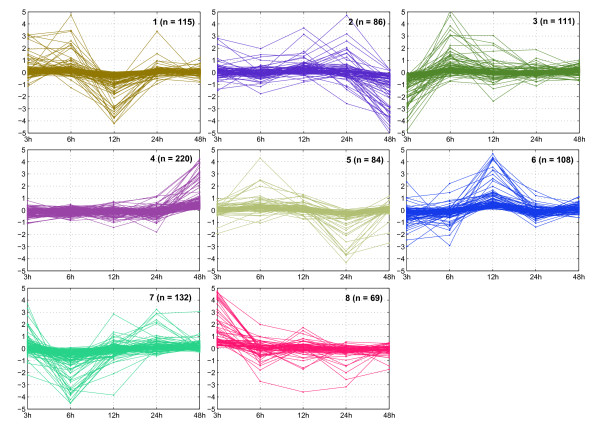
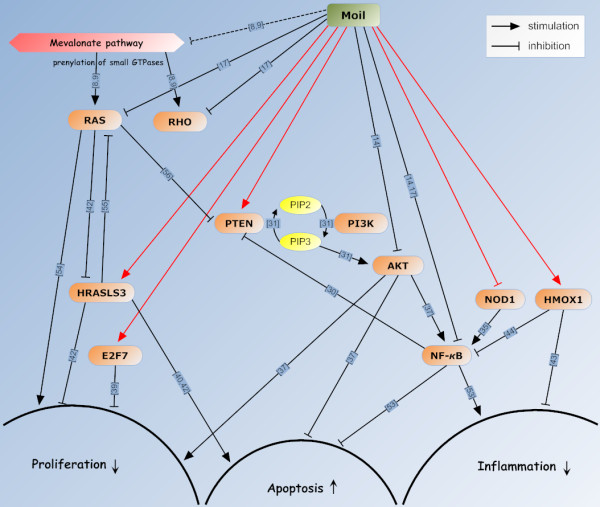
Results: In this work we demonstrated that exposure of Lewis lung carcinomas to mastic oil caused a time-dependent alteration in the expression of 925 genes. GO analysis associated expression profiles with several biological processes and functions. Among them, modifications on cell cycle/proliferation, survival and NF-kappaB cascade in conjunction with concomitant regulation of genes encoding for PTEN, E2F7, HMOX1 (up-regulation) and NOD1 (down-regulation) indicated some important mechanistic links underlying the anti-proliferative, pro-apoptotic and anti-inflammatory effects of mastic oil. The expression profiles of Hmox1, Pten and E2f7 genes were similarly altered by mastic oil in the majority of test cancer cell lines. Inhibition of PTEN partially reversed mastic oil effects on tumor cell growth, indicating a multi-target mechanism of action. Finally, k-means clustering, organized the significant gene list in eight clusters demonstrating a similar expression profile. Promoter analysis in a representative cluster revealed shared putative cis-elements suggesting a common regulatory transcription mechanism.

Conclusions: Present results provide novel evidence on the molecular basis of tumor growth inhibition mediated by mastic oil and set a rational basis for application of genomics and bioinformatic methodologies in the screening of natural compounds with potential cancer chemopreventive activities.


Figures

Figure 1
Figure 1
Volcano plots of the gene list as yielded by ANOVA. Each panel represents filtered and normalized data from each experimental time point (3, 6, 12, 24 and 48 h). The horizontal axes depict the fold change ratio between treatment with mastic oil and vehicle for each time point in log2 scale while the vertical axes represent statistical significance by depicting the -log10(p-value). Larger values in the vertical axes represent larger statistical significance. Differentially expressed genes (fold change>|0.2| in log2 scale, p-value < 0.05, FDR < 0.05) are shown in each panel where down-regulated genes are depicted by green dots and up-regulated genes by red dots. Non differentiated genes are shown as blue dots. Dashed lines indicate fold change thresholds and solid lines indicate the statistical significance (p-value) threshold. The p-value threshold of 0.05 corresponds to the value 1.3 in the vertical axes using the aforementioned transformation.
Figure 2
Figure 2
Selected GO categories and relevant genes. GO categories of interest and corresponding genes selected by fold change criteria as described in text. Values in 3, 6, 12, 24 and 48 h depict fold changes between mastic oil treatment and its corresponding control in log2 scale for each time point. The arrows from each GO category on the left to the genes in the table on the right show which genes are functionally connected to each GO category within the GO hierarchical model.
Figure 3
Figure 3
Validation of microarray data by RT-PCR. Four selected genes (Pten, Hmox1, Nod1 and E2f7) were analyzed by quantitative RT-PCR for microarray data confirmation. Error bars on each time point represent minimum and maximum relative expression values for RT-PCR data and standard deviations for the microarray experiment data. The dashed horizontal line across the value 1 on the vertical axes indicates that there is no difference in fold change ratios between treated and control cells. A. Expression levels measured by the two methods are shown for each time point. Specifically, for each of the depicted genes, the expression (in natural scale) of mastic oil treatment relative to its corresponding control, as derived from the microarray experiment and RT-PCR for each time point (3-48 h) is plotted and correlated. Overall, there is good correlation between microarray and RT-PCR validation data. B. The four selected genes from the analysis of microarray experiment were analyzed by quantitative RT-PCR in 3 cancer cell lines of human origin, namely A549, HCT116 and K562. Expression levels were measured for 4 distinct time points. Each panel shows the expression of mastic oil treatment relative to its control for each time point and for each cell line.
Figure 4
Figure 4
Inhibition of PTEN reverses mastic oil effect on K562 cell growth. K562 cells were treated with mastic oil alone (Moil, 0.007% v/v) or in the presence of PTEN inhibitor bpV(phen) (0.5 μM and 1 μM), bpV(phen) alone (1 μM) or DMSO as control. Cell numbers were measured after 24 h and results are expressed as mean percentage of DMSO control ± SD. The mean percentage of viable cells is significantly different between categories indicated by an asterisk as assessed by t-test (p < 0.05). The above statistics are derived from at least 3 independent experiments.
Figure 5
Figure 5
Clustering of gene expression profiles. Eight clusters of Illumina probe sets comprising similar expression profiles were identified by k-means clustering as described in methods. Each panel depicts one cluster of genes showing similar expression profile. The vertical axes depict fold changes in log2 scale between mastic oil treatment and its corresponding control for each time point, as derived from microarray data analysis. n depicts the number of probe sets in each cluster.
Figure 6
Figure 6
Model of mastic oil action mechanisms in LLC cells. Schematic representation of target molecules and pathways underlying mastic oil-mediated chemopreventive effects on tumor cell proliferation, apoptosis and inflammation based on available literature (black arrows) and evidence as derived from the present study for LLC cells (red arrows). Dashed line indicates prediction of activity based on experimental evidence from mastic oil components. Numbers on arrows correspond to respective references indicated in the text and also interactions described in references [53-56].

Similar articles

Cited by

References

    1. Jemal A, Murray T, Ward E, Samuels A, Tiwari RC, Ghafoor A, Feuer EJ, Thun MJ. Cancer statistics, 2005. CA Cancer J Clin. 2005;55(1):10–30. doi: 10.3322/canjclin.55.1.10. - DOI - PubMed
    1. American Institute for Cancer Research, World Cancer Research Fund. Food, nutrition, physical activity and the prevention of cancer: a global perspective: a project of World Cancer Research Fund International. Washington, D.C.: American Institute for Cancer Research; 2007.
    1. Gopalakrishnan A, Tony Kong AN. Anticarcinogenesis by dietary phytochemicals: cytoprotection by Nrf2 in normal cells and cytotoxicity by modulation of transcription factors NF-kappa B and AP-1 in abnormal cancer cells. Food Chem Toxicol. 2008;46(4):1257–1270. doi: 10.1016/j.fct.2007.09.082. - DOI - PubMed
    1. Surh YJ. Cancer chemoprevention with dietary phytochemicals. Nature reviews. 2003;3(10):768–780. doi: 10.1038/nrc1189. - DOI - PubMed
    1. de Kok TM, van Breda SG, Manson MM. Mechanisms of combined action of different chemopreventive dietary compounds: a review. Eur J Nutr. 2008;47(Suppl 2):51–59. doi: 10.1007/s00394-008-2006-y. - DOI - PubMed

Publication types