. 2010 Jan;14(1):40-8.
doi: 10.1016/j.tics.2009.10.011. Epub 2009 Dec 11.

Reliability of cortical activity during natural stimulation

Affiliations

Reliability of cortical activity during natural stimulation

Uri Hasson et al. Trends Cogn Sci. 2010 Jan.

Abstract

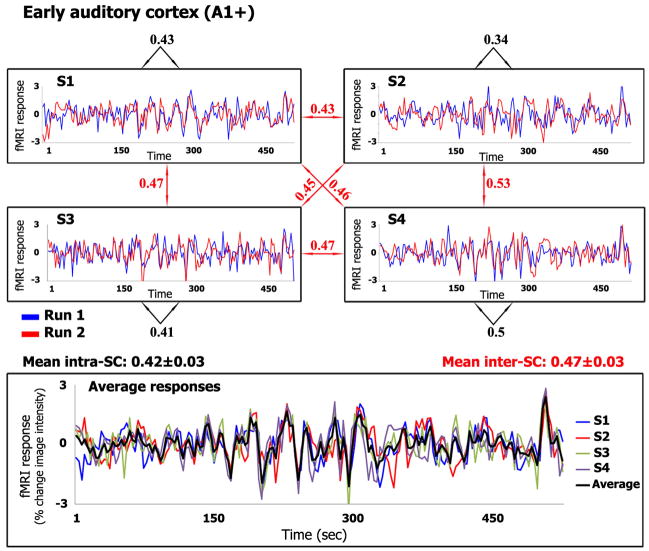
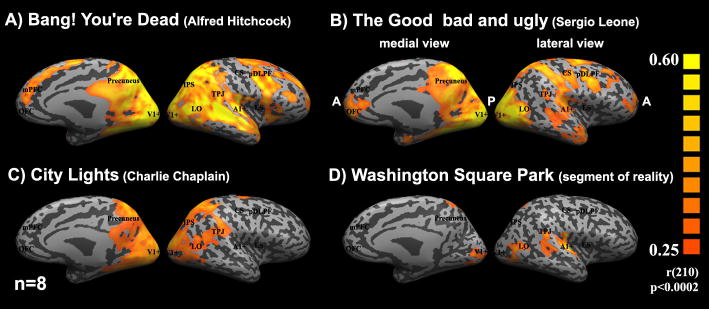
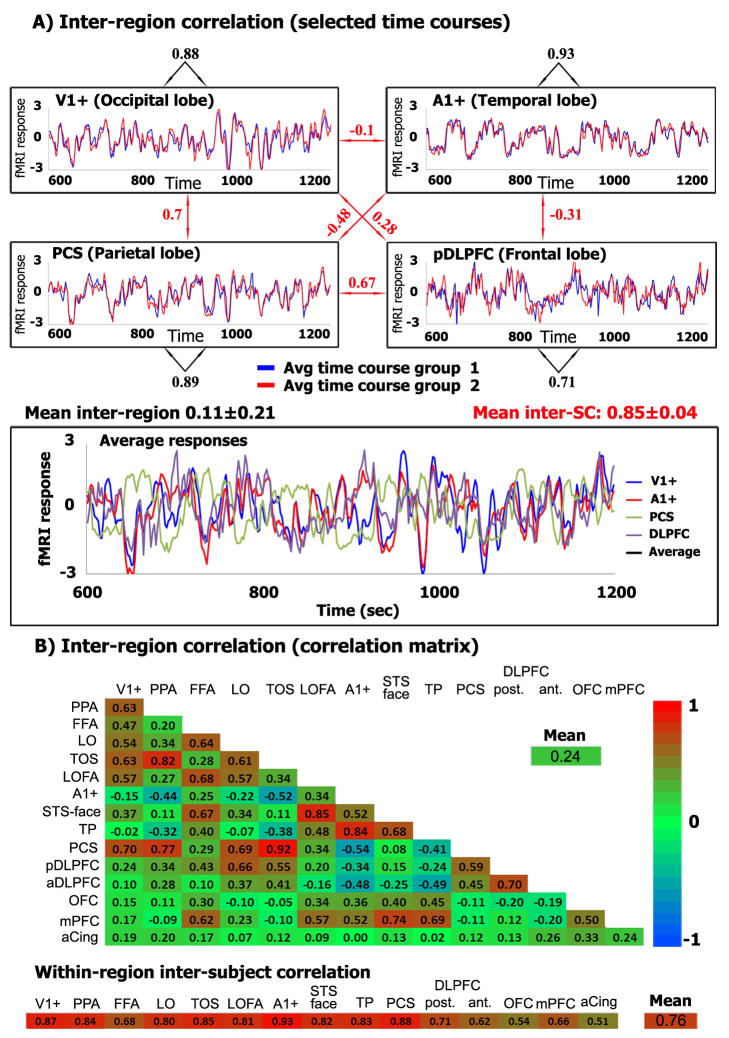
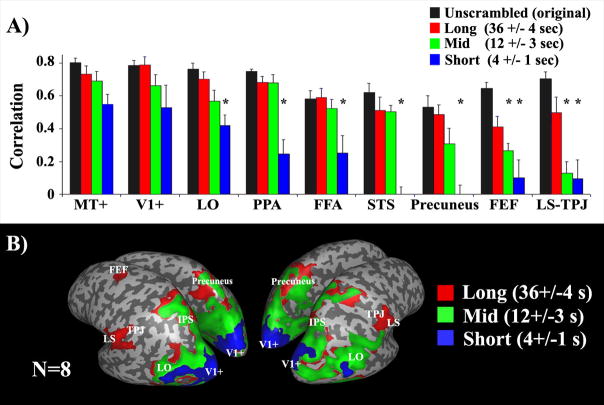
Response reliability is complementary to more conventional measurements of response amplitudes, and can reveal phenomena that response amplitudes do not. Here we review studies that measured reliability of cortical activity within or between human subjects in response to naturalistic stimulation (e.g. free viewing of movies). Despite the seemingly uncontrolled nature of the task, some of these complex stimuli evoke highly reliable, selective and time-locked activity in many brain areas, including some regions that show little response modulation in most conventional experimental protocols. This activity provides an opportunity to address novel questions concerning natural vision, temporal scale of processing, memory and the neural basis of inter-group differences.


Figures

Figure 1
Figure 1
Reliability within and between subjects Upper panels: Responses evoked by the Sergio Leone movie, from early auditory cortex (A1+, see Glossary) in each of four subjects. Each subject watched the movie twice. The two curves in each panel correspond to responses evoked within each subject (S1, S2, S3, and S4) by the repeated presentations. Black numbers: Correlation coefficient between the two response time courses within each subject (intra-SC). Red numbers: Correlation coefficients across subjects (inter-SC). Lower panel: Response time courses for each subject, averaged across the two repetitions, and grand mean averaged across the four subjects (black curve). The results shown here for the Sergio Leone movie (and in subsequent figures) are from a replication of the originally published data set [4]; we repeated the experiment in order to have a direct comparison between this and the other films (same fMRI scanner and data acquisition protocol) for Figure 2.
Figure 2
Figure 2
Reliability of responses to different movies Medial and lateral views of “inflated” right hemisphere depicting the inter-SC maps for four different movies. Posterior areas (P) are toward the middle of each panel, while anterior areas (A) are facing the sides. The fMRI measurements for all four movies were acquired with the same equipment and procedures. In addition, to have comparable statistical power, we matched the number of subjects (n=8), and the length of the time courses of all stimuli by extracting seven minutes of fMRI measurements from each of them. Inter-SC was computed by first splitting the eight subjects into two groups, averaging the response time courses separately for each group, and then computing the correlation coefficients between the two resulting response time courses at each cortical location. Colored regions represent locations for which the correlations exceeded a threshold value (0.25, p<0.002; chosen because it was above the highest inter-SC value exhibited by any voxel for two different movies). The Hitchcock episode and the Leone and Chaplin movies evoked far greater and more extensive inter-SC than the real-life, unedited video. The Hitchcock episode evoked more reliable responses in prefrontal cortex than the other three stimuli.
Figure 3
Figure 3
Selectivity of responses in different brain regions (A) Responses evoked by the Hitchcock episode, from each of four distinct brain regions (see Glossary for abbreviations). Upper panels: Response time courses averaged separately across each brain region and separately for each of two groups of subjects (blue, group 1, n=12; red, group 2, n=11). Black numbers: Correlation coefficients between the two response time courses within each brain region, across the two groups of subjects. Red numbers: Correlation coefficients across brain regions. Lower panel: Mean response time courses for each brain region, averaged across all 23 subjects. (B) Inter-region correlations and within-region inter-subject correlations for 15 example brain areas. Upper panel: Matrix of inter-region correlations computed by first averaging across all 23 subjects. Lower panel: Within-region inter-subject correlations computed by first averaging the response time courses separately for the two groups of subjects, and then computing the correlation coefficients between the two resulting response time courses within each brain region. Color indicates the strength of the correlation coefficients. Although the response time courses within a specific brain region are highly reliable across viewers, they are unique and distinctive across brain areas.
Figure 4
Figure 4
Response reliability and temporal receptive windows (adapted from ref. [5]) (A) Response correlation across repeated presentations, as a function of temporal disruption of the same movie, in each of several brain regions. Black bars: Response correlations for the unshuffled original movies that had the most coherent temporal structures. Red, green and blue: Response correlations for movies that were shuffled at long (36±4 seconds), intermediate (12±3 seconds), and short (4±1 seconds) time scales, respectively. Asterisks indicate that the response correlations were significantly smaller (p<0.05, one-tailed t-test after applying Fisher transformation to normalize the distribution of the r values) than those evoked by the unshuffled original version. Early visual areas (V1, MT+, see Glossary) exhibited no difference across conditions. LO, FFA, PPA, STS, and precuneus exhibited smaller correlation values when the films were shuffled at a short time scale. LS, TPJ, and FEF responses were reproducible only for the longest time scales. (B) Map of brain regions with different temporal receptive windows. Blue: Brain regions in which the response correlations were high for all shuffled movies (at long, intermediate, and short time scales). Green: Regions in which the response correlations were high only for the long and intermediate time scales, but not when the shots were shuffled at a short time scale (e.g., LO, PPA, FFA, STS). Red: Regions in which the response correlations were high only for the longest time scales (e.g., LS, TPJ, and FEF).

References

    1. Mechler F, et al. Robust temporal coding of contrast by V1 neurons for transient but not for steady-state stimuli. J Neurosci. 1998;18(16):6583–98. - PMC - PubMed
    1. Yao H, et al. Rapid learning in cortical coding of visual scenes. Nat Neurosci. 2007;10(6):772–8. - PubMed
    1. Belitski A, et al. Low-frequency local field potentials and spikes in primary visual cortex convey independent visual information. J Neurosci. 2008;28(22):5696–709. - PMC - PubMed
    1. Hasson U, et al. Intersubject synchronization of cortical activity during natural vision. Science. 2004;303(5664):1634–40. - PubMed
    1. Hasson U, et al. A hierarchy of temporal receptive windows in human cortex. J Neurosci. 2008;28(10):2539–50. - PMC - PubMed

Publication types