

Infrared reflection-absorption spectroscopy: principles and applications to lipid-protein interaction in Langmuir films
- PMID: 20004639
- PMCID: PMC2842972
- DOI: 10.1016/j.bbamem.2009.11.024
Infrared reflection-absorption spectroscopy: principles and applications to lipid-protein interaction in Langmuir films
Abstract
Infrared reflection-absorption spectroscopy (IRRAS) of lipid/protein monolayer films in situ at the air/water interface provides unique molecular structure and orientation information from the film constituents. The technique is thus well suited for studies of lipid/protein interaction in a physiologically relevant environment. Initially, the nature of the IRRAS experiment is described and the molecular structure information that may be obtained is recapitulated. Subsequently, several types of applications, including the determination of lipid chain conformation and tilt as well as elucidation of protein secondary structure are reviewed. The current article attempts to provide the reader with an understanding of the current capabilities of IRRAS instrumentation and the type of results that have been achieved to date from IRRAS studies of lipids, proteins, and lipid/protein films of progressively increasing complexity. Finally, possible extensions of the technology are briefly considered.
Copyright 2009 Elsevier B.V. All rights reserved.
Figures

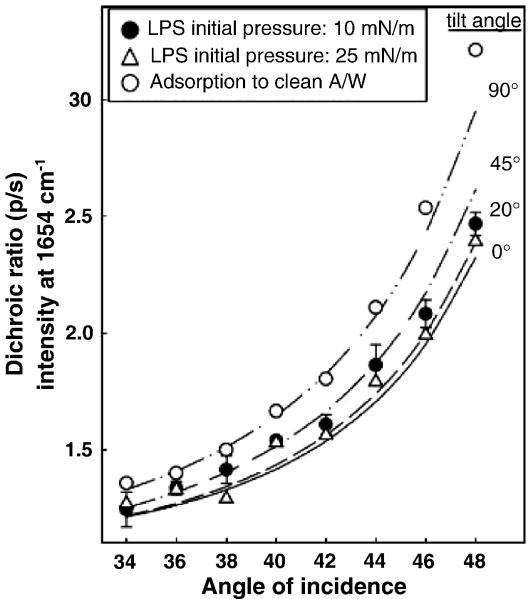
 ).
).
 ).
).
 ).
).
 and from Professor Rich Dluhy, University of Georgia).
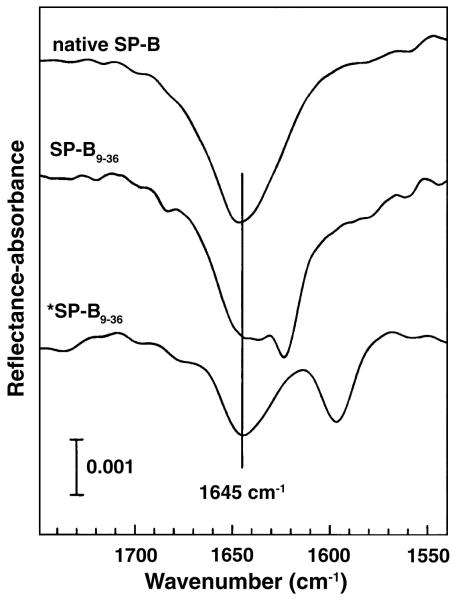
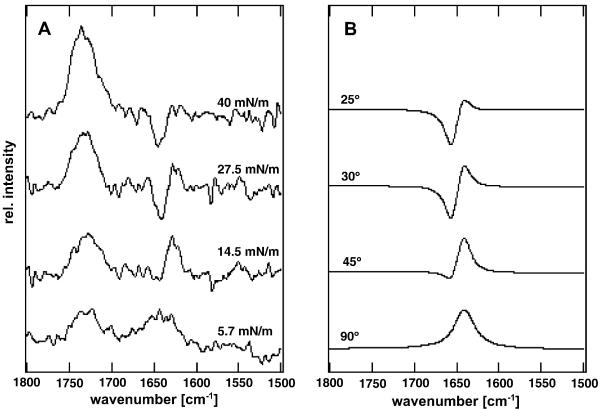
 ). (Figure courtesy of Professor Arne Gericke, of Kent State University).
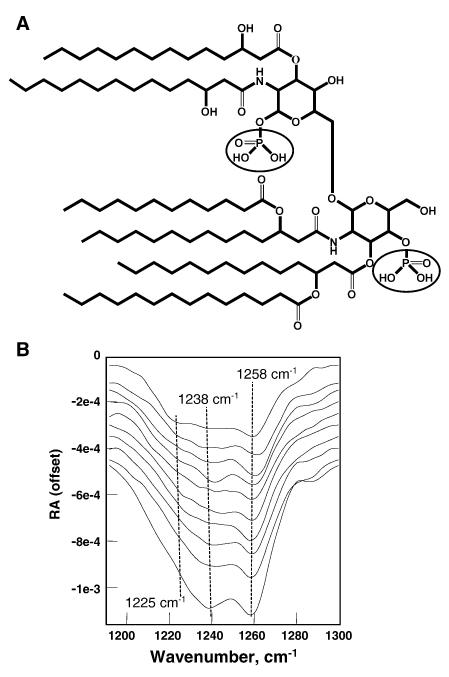
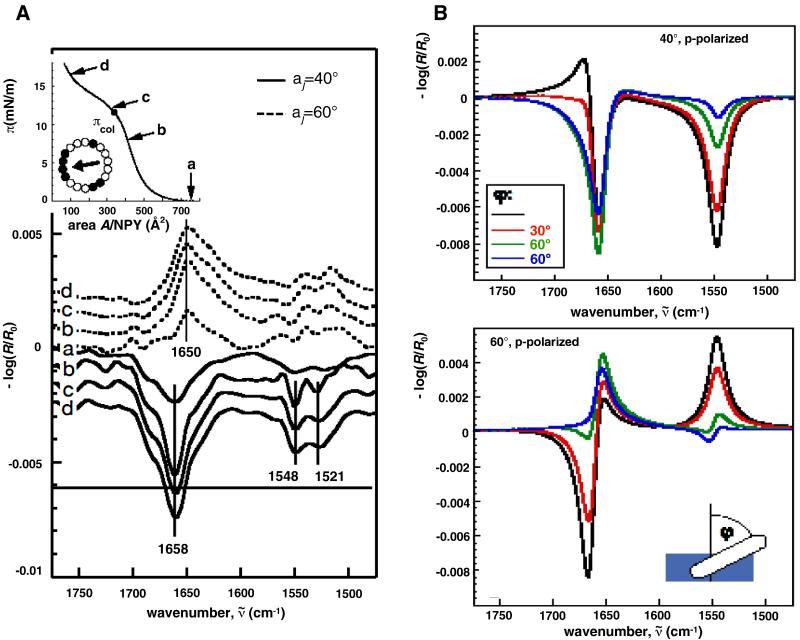
 (Figure courtesy of Professor Bernard Desbat, CNRS, Talence Cedex, France).
 ).
).
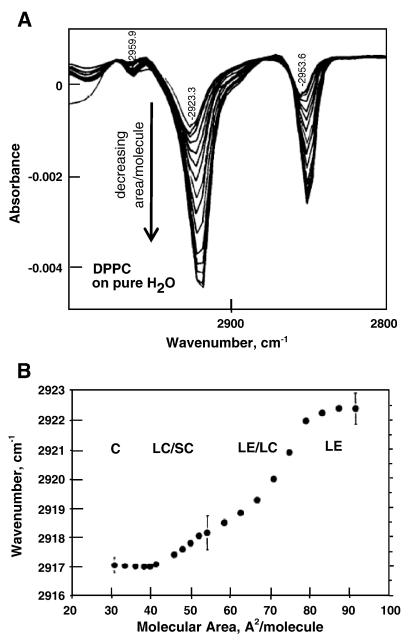
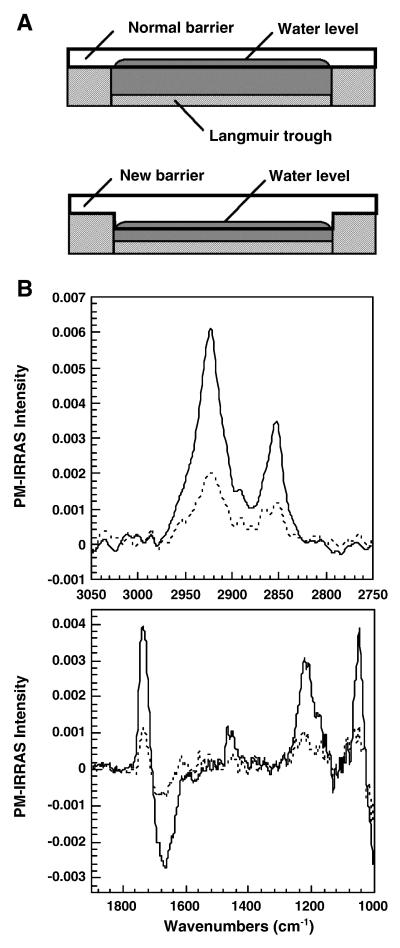
 ) (Figure courtesy of Professor Mathias Lösche, Carnegie-Mellon University).
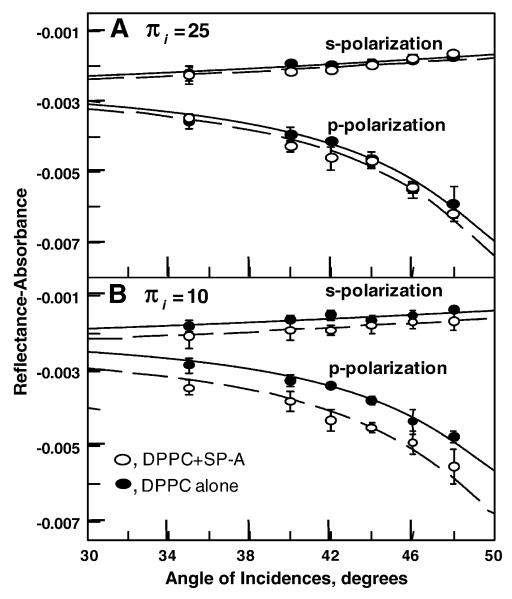
 ).
).
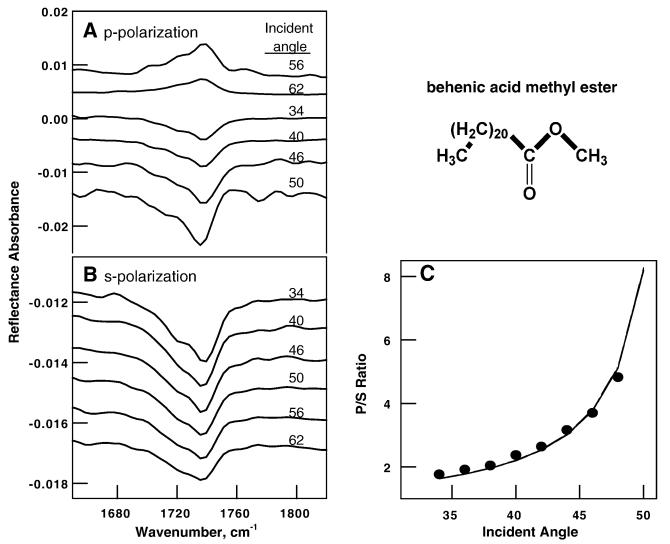
 ) (Figure courtesy of Professor Horst Vogel, Ecole Polytechnique Federale de Lausanne and Dr. Peter Ulrich, SCIPROM, St-Sulpice, Switzerland).
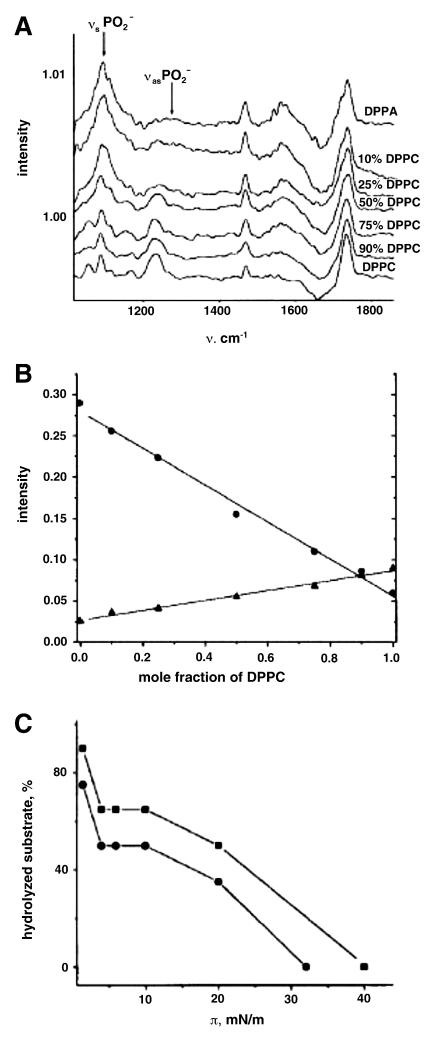
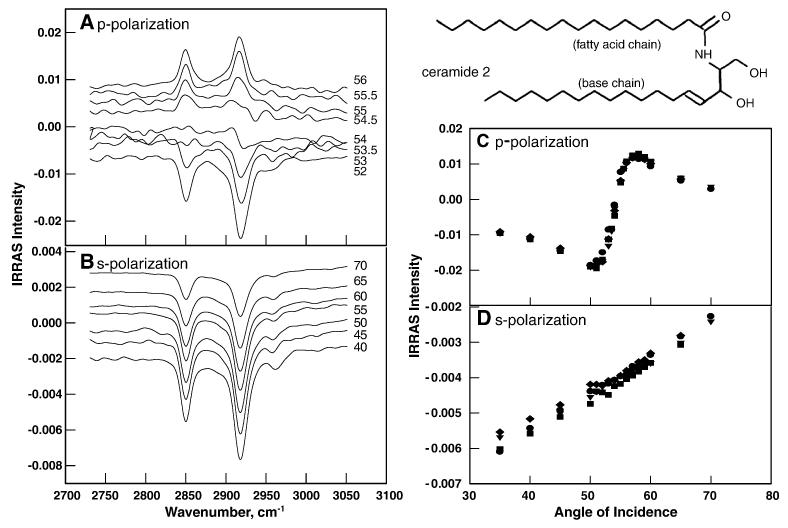
 and Professor Gerald Brezesinski, Max Planck Institute of Colloids and Interfaces, Golm/Potsdam, Germany).
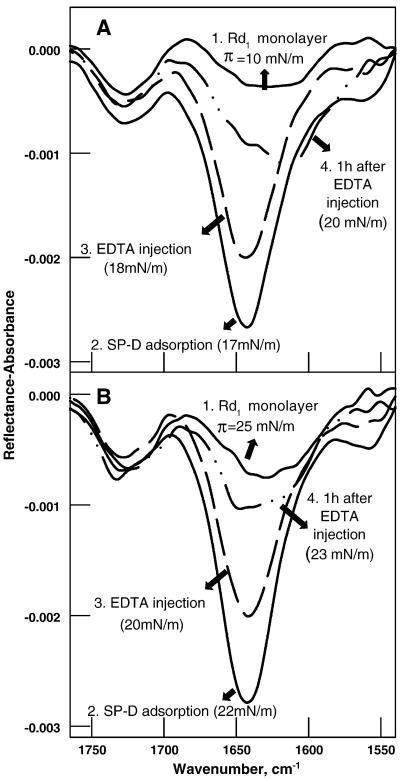
 ).
).
 ).
).
 and from Professor John Rabolt, University of Delaware).
References
-
- Schürch S, Green FHY, Bachofen H. Formation and structure of surface films: captive bubble surfactometry. Biochim. Biophys. Acta. 1998;1408:180–202. - PubMed
-
- Clements JA. Functions of the alveolar lining. Am. Rev. Respir. Dis. 1977;115:67–71. - PubMed
-
- Lichtenberg D, Romero G, Menashe M, Biltonen RL. Hydrolysis of dipalmitoylphosphatidylcholine large unilamellar vesicles by porcine pancreatic phospholipase A2. J. Biol. Chem. 1986;261:5334–5340. - PubMed
-
- Möhwald H. Direct characterization of monolayers at the air-water interface. Thin Solid Films. 1988;159:1–15.
-
- Möhwald H. Phospholipid and phospholipid-protein monolayers at the air/water interface. Annu. Rev. Phys. Chem. 1990;41:441–476. - PubMed
Publication types
MeSH terms
Substances
Grants and funding
LinkOut - more resources
Full Text Sources
