

Eosinophilic gastrointestinal disease and peanut allergy are alternatively associated with IL-5+ and IL-5(-) T(H)2 responses
- PMID: 20004787
- PMCID: PMC2994258
- DOI: 10.1016/j.jaci.2009.09.048
Eosinophilic gastrointestinal disease and peanut allergy are alternatively associated with IL-5+ and IL-5(-) T(H)2 responses
Abstract
Background: Both anaphylactic food allergy and eosinophil-associated gastrointestinal disorders are associated with T(H)2 responses and food-specific IgE, yet they have very different clinical presentations.
Objective: To determine whether the clinical differences between anaphylactic food allergy and eosinophil-associated gastrointestinal disorders are reflected in different T(H)2 responses to foods.
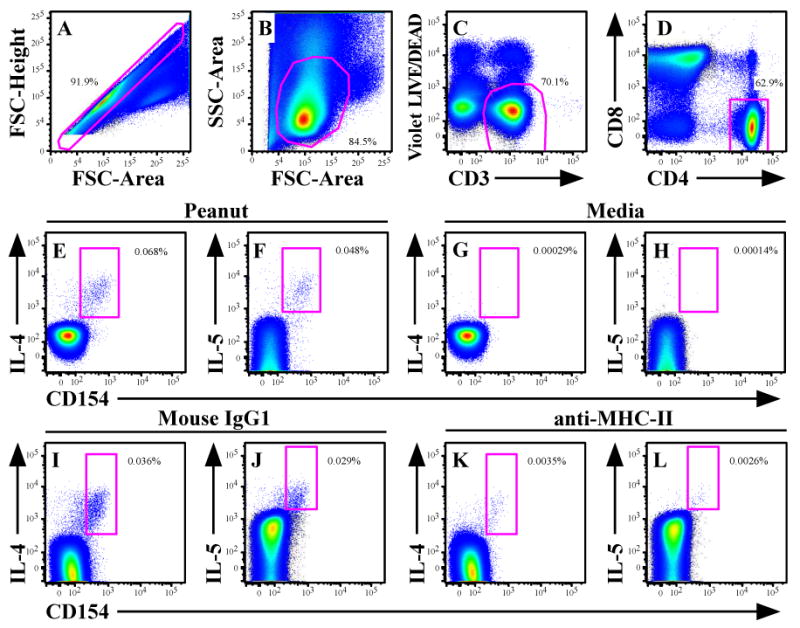
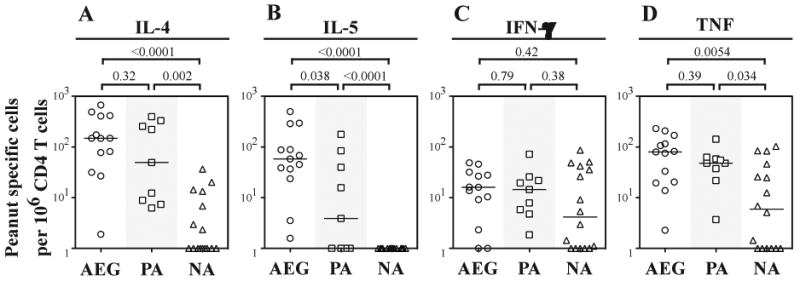
Methods: Subjects with peanut allergy (PA), subjects with allergic eosinophilic gastroenteritis (AEG), and nonatopic subjects were enrolled. Antigen-specific IL-4, IL-5, IFN-gamma, and TNF T-cell responses to peanut, soy, and shrimp were measured by using intracellular cytokine staining and polychromatic flow cytometry.
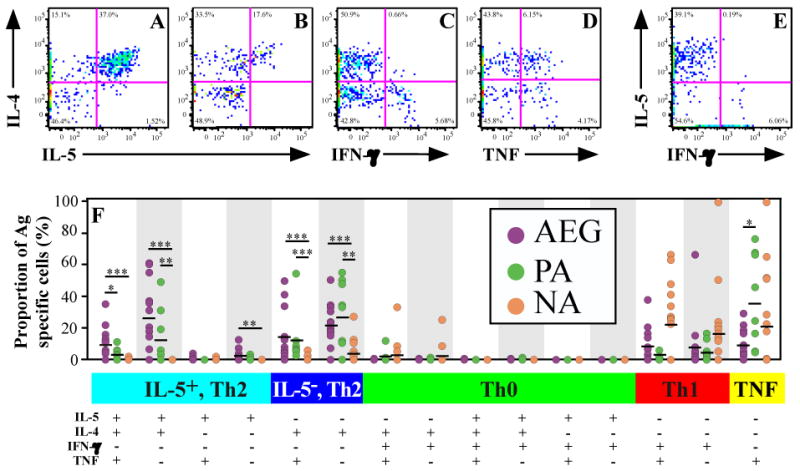
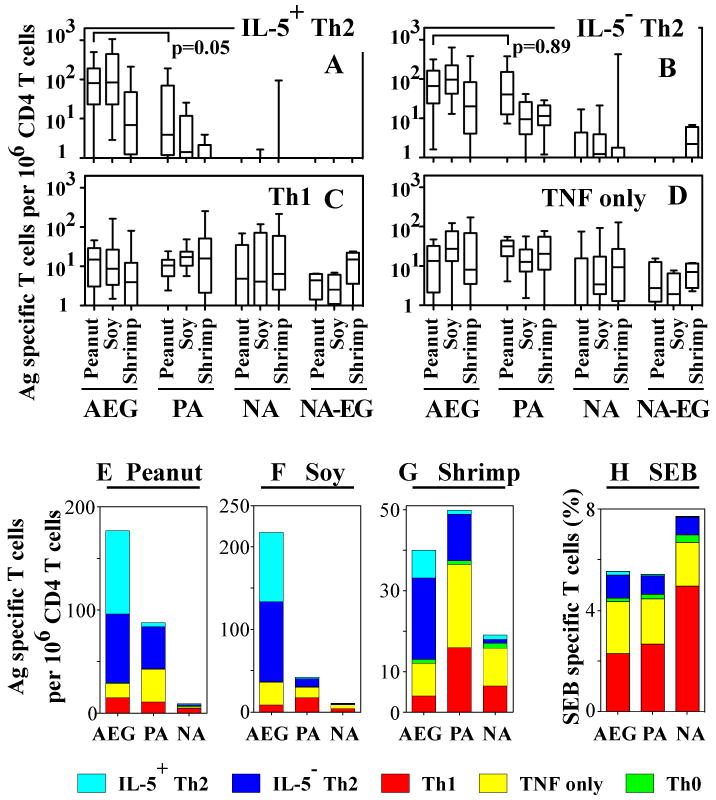
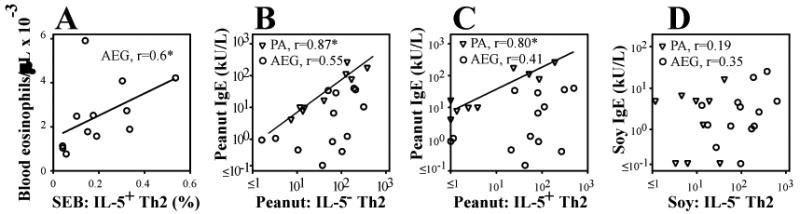
Results: Two distinct subpopulations of T(H)2 cells were found: IL-5+ T(H)2 (IL-4+, IL-5+) and IL-5(-) T(H)2 (IL-4+, IL-5(-)) cells. Peanut-specific IL-5+ T(H)2 cells were present at a 20-fold greater frequency in AEG versus PA (81 vs 4 per 10(6) CD4 cells; P = .05), whereas there were similar frequencies of IL-5(-) T(H)2 cells (67 vs 41 per 10(6)). For all foods, IL-5+ T(H)2 cells accounted for a significantly greater fraction of the antigen-specific cells in AEG relative to PA (29% vs 4%; P < .0001). In PA but not AEG, IL-5(-) T(H)2 responses to peanut were highly correlated with peanut-specific IgE (r = 0.87 vs 0.55, respectively). All subject groups elicited similar very low-magnitude T(H)1 responses to food antigens.
Conclusion: T(H)2 responses are composed of 2 subpopulations: IL-5+ T(H)2 and IL-5(-) T(H)2 cells. IL-5+ T(H)2 food allergen-specific T cells are singularly associated with AEG, whereas PA is associated with a dominant IL-5(-) T(H)2 response. These results suggest heterogeneity within the T(H)2 cytokine response, with different T(H)2 responses alternatively favoring IgE-mediated or eosinophil-dominant immunopathology.
Trial registration: ClinicalTrials.gov NCT00001756 NCT00084097 NCT00557895.
Figures
References
-
- Branum A, Lukacs S. Food allergy among US children: Prevalence and hospital visits. American Journal of Epidemiology. 2008;167:S18–S.
-
- Sicherer SH, Sampson HA. Food Allergy: Recent Advances in Pathophysiology and Treatment. Annu Rev Med. 2008 - PubMed
-
- Rothenberg ME. Eosinophilic gastrointestinal disorders (EGID) J Allergy Clin Immunol. 2004;113:11–28. - PubMed
-
- Liacouras CA, Spergel JM, Ruchelli E, Verma R, Mascarenhas M, Semeao E, et al. Eosinophilic esophagitis: a 10-year experience in 381 children. Clin Gastroenterol Hepatol. 2005;3:1198–206. - PubMed
-
- Roy-Ghanta S, Larosa DF, Katzka DA. Atopic characteristics of adult patients with eosinophilic esophagitis. Clin Gastroenterol Hepatol. 2008;6:531–5. - PubMed
Publication types
MeSH terms
Substances
Associated data
Grants and funding
LinkOut - more resources
Full Text Sources
Other Literature Sources
Medical
Research Materials
