. 2009 Dec 29;19(24):2126-32.
doi: 10.1016/j.cub.2009.10.070. Epub 2009 Dec 10.

Preferential ethanol consumption in Drosophila models features of addiction

Affiliations

Preferential ethanol consumption in Drosophila models features of addiction

Anita V Devineni et al. Curr Biol. .

Abstract

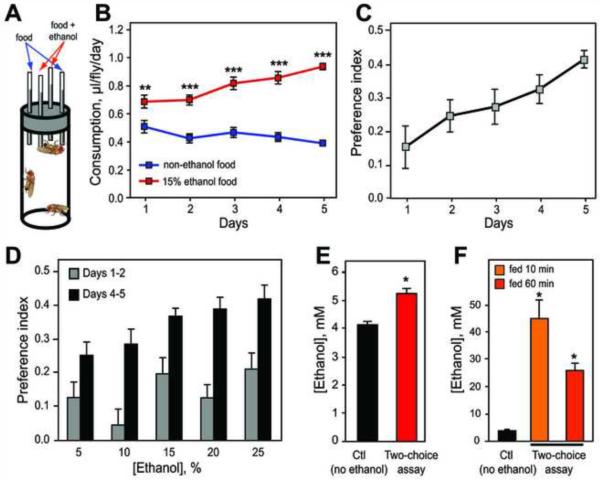
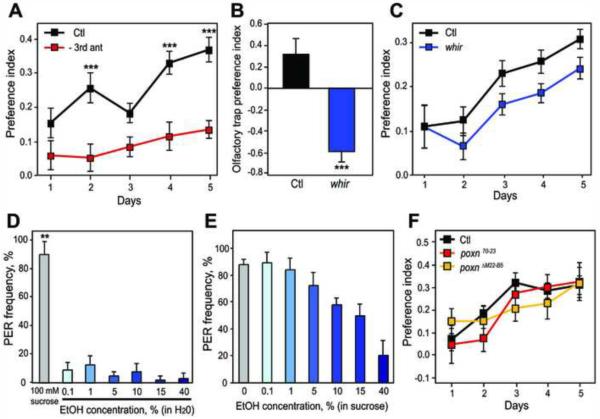
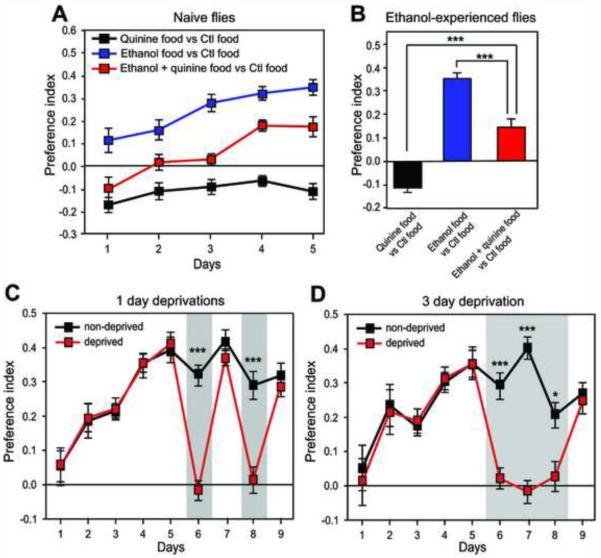
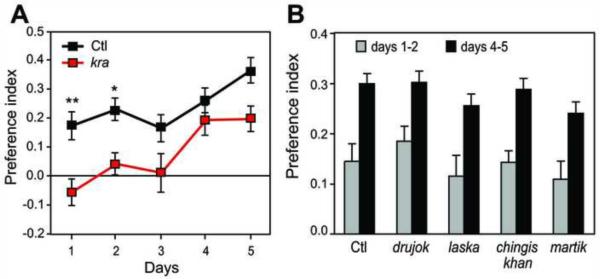
Alcohol addiction is a common affliction with a strong genetic component [1]. Although mammalian studies have provided significant insight into the molecular mechanisms underlying ethanol consumption [2], other organisms such as Drosophila melanogaster are better suited for unbiased, forward genetic approaches to identify novel genes. Behavioral responses to ethanol, such as hyperactivity, sedation, and tolerance, are conserved between flies and mammals [3, 4], as are the underlying molecular pathways [5-9]. However, few studies have investigated ethanol self-administration in flies [10]. Here we characterize ethanol consumption and preference in Drosophila. Flies prefer to consume ethanol-containing food over regular food, and this preference increases over time. Flies are attracted to the smell of ethanol, which partially mediates ethanol preference, but are averse to its taste. Preference for consuming ethanol is not entirely explained by attraction to either its sensory or caloric properties. We demonstrate that flies can exhibit features of alcohol addiction. First, flies self-administer ethanol to pharmacologically relevant concentrations. Second, flies will overcome an aversive stimulus in order to consume ethanol. Third, flies rapidly return to high levels of ethanol consumption after a period of imposed abstinence. Thus, ethanol preference in Drosophila provides a new model for studying aspects of addiction.


Figures

Figure 1
Figure 1. Ethanol Preference in Drosophila
(A) Schematic of the ethanol preference assay (not to scale). Flies choose between liquid food containing 0% or 15% ethanol. Each food type is presented in 2 capillaries to increase the food supply and decrease variability. (B) Flies consumed a greater amount of 15% ethanol food than non-ethanol food in the preference assay (**p<.01, ***p<.001, two-way repeated measures ANOVA with Bonferroni post-tests, n=16). (C) PI calculated from consumption values (see text for formula). PI increased over time (p<.01, one-way repeated measures ANOVA, n=16). (D) The concentration of the ethanol-containing food was varied between 5% and 25% ethanol, and PI values on days 1 and 2 and days 4 and 5 were averaged to compare preference at the beginning and end of the assay. PI increased with increasing ethanol concentration at the end (p<.05) but not the beginning (p>.05) of the assay (one-way ANOVAs, n=16). (E) Ethanol concentration in flies during the preference assay was significant compared with control flies that never consumed ethanol (*p<.05, Mann-Whitney test, n=3–5 samples). (F) Ethanol concentrations in flies that were starved and then refed for 10 or 60 min in the preference assay were higher than those of control flies that were also starved/refed but not offered ethanol (*p<.05 compared with control, Mann-Whitney tests, n=3–12 samples). In this and all other figures, data are represented as mean ± SEM.
Figure 2
Figure 2. Olfactory Attraction and Gustatory Aversion Differentially Influence Ethanol Preference
(A) Flies lacking the third antennal segment had decreased ethanol preference compared with control flies (***p<.001, two-way repeated measures ANOVA with Bonferroni post-tests, n=24). (B) Wild type flies exhibited positive preference for ethanol in the olfactory trap assay, while whir mutants exhibited olfactory repulsion (***p<.001 for whir vs. control, Student's unpaired t test, n=12). (C) whir mutants exhibited positive ethanol preference. whir preference displayed a non-significant decrease compared with the control (p=.06, two-way repeated measures ANOVA, n=24). (D) Ethanol diluted in water did not elicit significant PER (p>.05 for all concentrations). 100 mM sucrose was used as a positive control and elicited significant PER (**p<.01, one sample t tests, n=3 experiments). (E) When added to 100 mM sucrose, ethanol caused a dose-dependent decrease in PER frequency (p<.001, one-way repeated measures ANOVA, n=3 experiments). (F) poxnΔM22-B5 and poxn7023 mutants exhibited ethanol preference similar to the control (p>.05, two-way repeated measures ANOVA, n=16).
Figure 3
Figure 3. Ethanol Preference in Flies Exhibits Features of Addiction
(A) Over time, naive flies developed ethanol preference when 300 μM quinine was added to the ethanol food throughout the assay. These flies had no preference on days 1–3 (p>.05), but had a positive preference on days 4 (p<.001) and 5 (p<.01). In the absence of ethanol, flies exhibited quinine aversion (p<.05 on all days, one sample t tests, n=16). (B) Flies that had been drinking in the preference assay for 5 days continued to exhibit ethanol preference when 300 μM quinine was added to the ethanol food on the sixth day (p<.01, one sample t test, n=16), though this preference was decreased compared with controls lacking quinine. All 3 groups are significantly different from each other (***p<.001, one-way ANOVA with Tukey's post-test, n=16). (C) After 5 days of drinking, flies were divided into two groups, one of which was deprived of ethanol access for two intermittent 1 day intervals (shaded). PI of the deprived group differed from the non-deprived group only during the deprivation periods (day 6 and day 8, ***p<.001). Post-deprivation PI did not differ from pre-deprivation PI (p>.05 for day 7 vs. day 5 and day 9 vs. day 7) or from the non-deprived group (p>.05 for day 7 and day 9). (D) Same as (C) using a single 3 day deprivation. PI of the deprived group differed from the non-deprived group only during deprivation (days 6–8, *p<.05, ***p<.001). Post-deprivation PI did not differ from pre-deprivation PI or from the non-deprived group (p>.05). In (C) and (D), one- or two-way repeated measures ANOVAs with Bonferroni's post-tests were used to compare values within the deprived group or between deprived and non-deprived groups, respectively. n=20 in (C) and n=10 in (D).
Figure 4
Figure 4. kra Exhibits Defects in Ethanol Preference
(A) kra displayed decreased ethanol preference compared with the control (p<.001, two-way repeated measures ANOVA) which was most pronounced at the beginning of the assay (*p<.05, **p<.01, Bonferroni's post-tests, n=25). (B) The long-term memory mutants drujok, laska, chingis khan, and martik displayed ethanol preference similar to the control (p>.05, two-way repeated measures ANOVA, n=22).

Similar articles

Cited by

References

    1. Dick DM, Foroud T. Candidate genes for alcohol dependence: a review of genetic evidence from human studies. Alcohol Clin. Exp. Res. 2003;27:868–879. - PubMed
    1. Crabbe JC, Phillips TJ, Harris RA, Arends MA, Koob GF. Alcohol-related genes: contributions from studies with genetically engineered mice. Addict. Biol. 2006;11:195–269. - PubMed
    1. Wolf FW, Rodan AR, Tsai LT-Y, Heberlein U. High-resolution analysis of ethanol-induced locomotor stimulation in Drosophila. J. Neurosci. 2002;22:11035–11044. - PMC - PubMed
    1. Scholz H, Ramond J, Singh CM, Heberlein U. Functional ethanol tolerance in Drosophila. Neuron. 2000;28:261–271. - PubMed
    1. Moore MS, DeZazzo J, Luk AY, Tully T, Singh CM, Heberlein U. Ethanol intoxication in Drosophila: genetic and pharmacological evidence for regulation by the cAMP signaling pathway. Cell. 1998;93:997–1007. - PubMed

Publication types

MeSH terms